1 / 120

A Detailed Economic Analysis of the Modi Sarkar
2 / 120
Why This Report Card
3 / 120
Contents
4 / 120
Industrial Productivity and Output
5 / 120
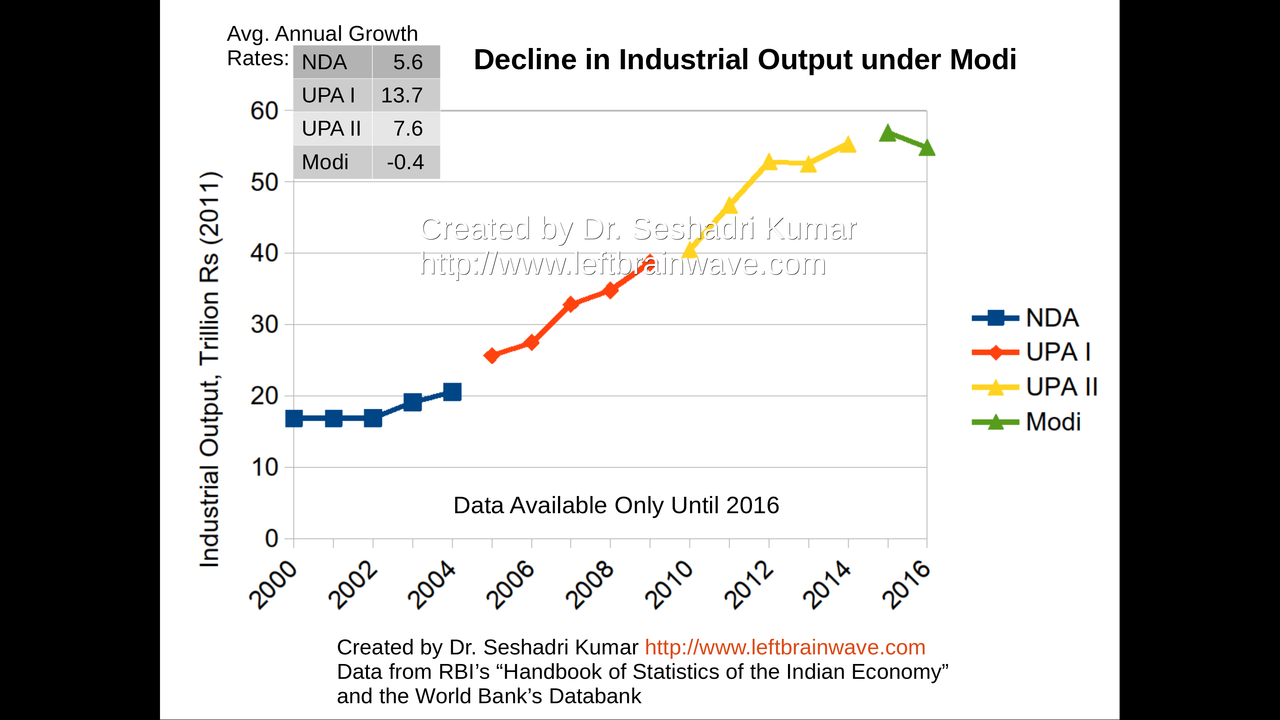
Industrial Output Growth for Different Regimes
6 / 120
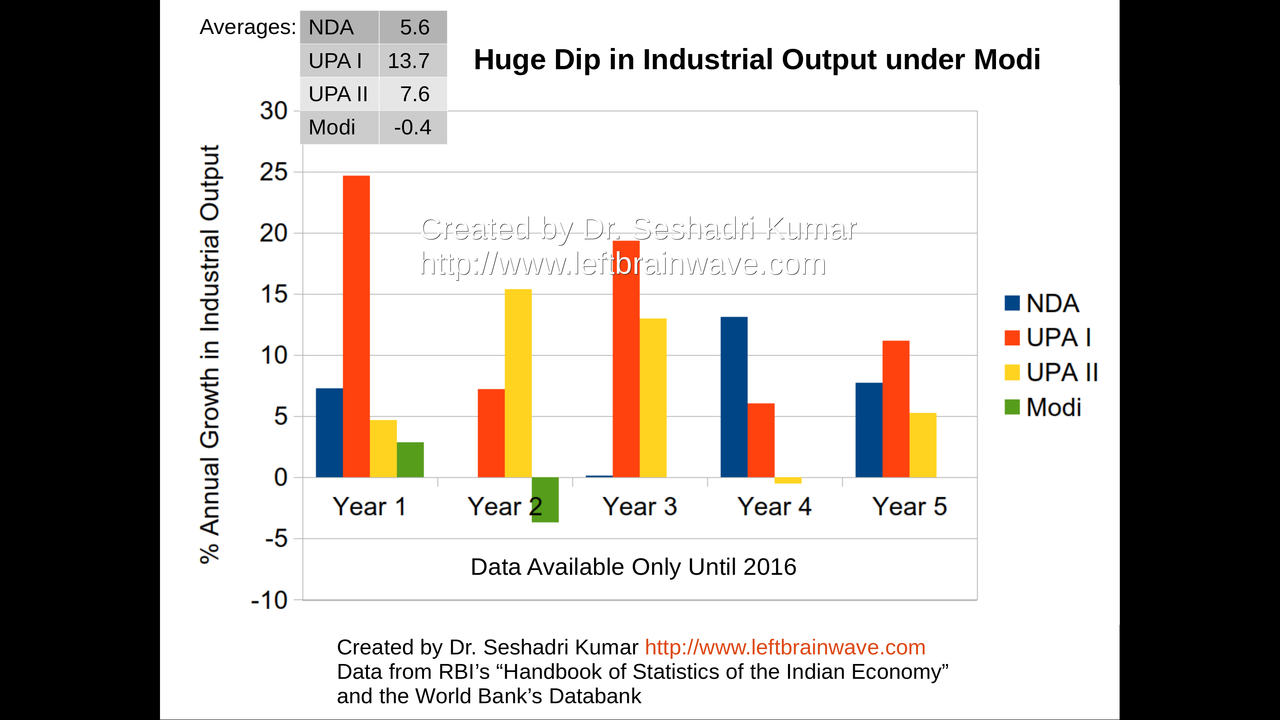
Industrial Output Growth for Different Regimes
7 / 120
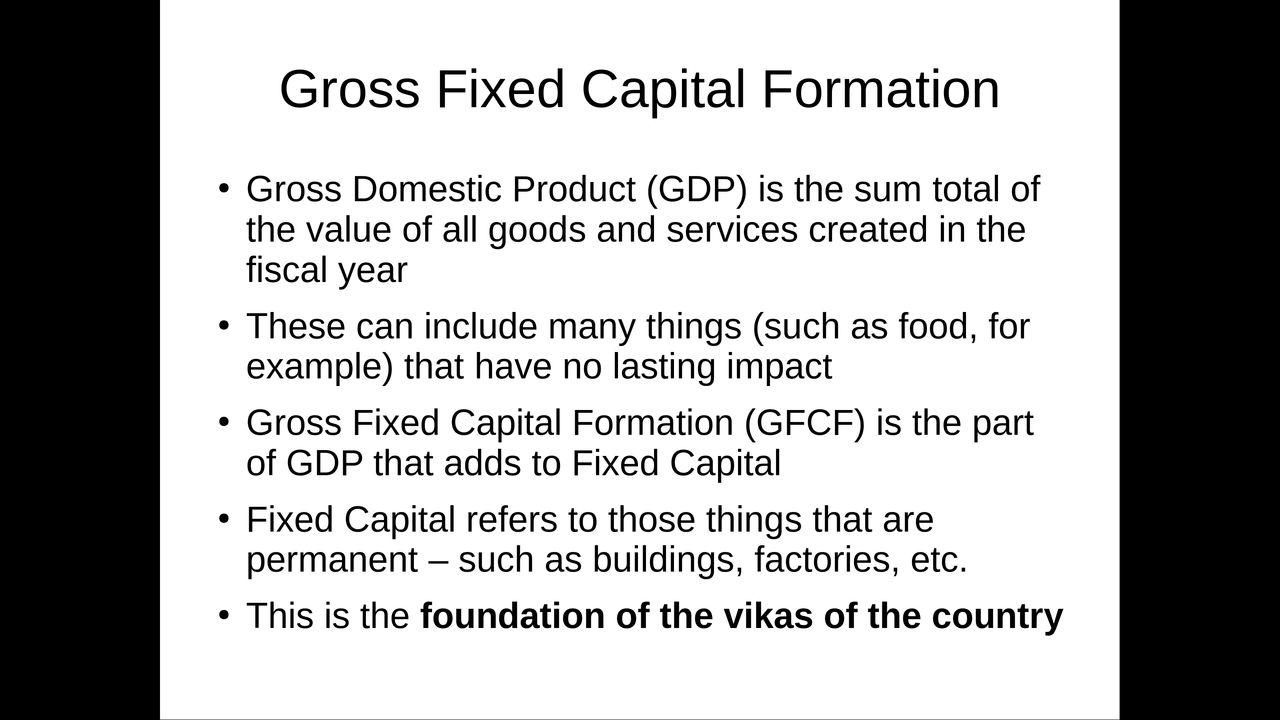
Gross Fixed Capital Formation
8 / 120

GFCF for Different Regimes
9 / 120
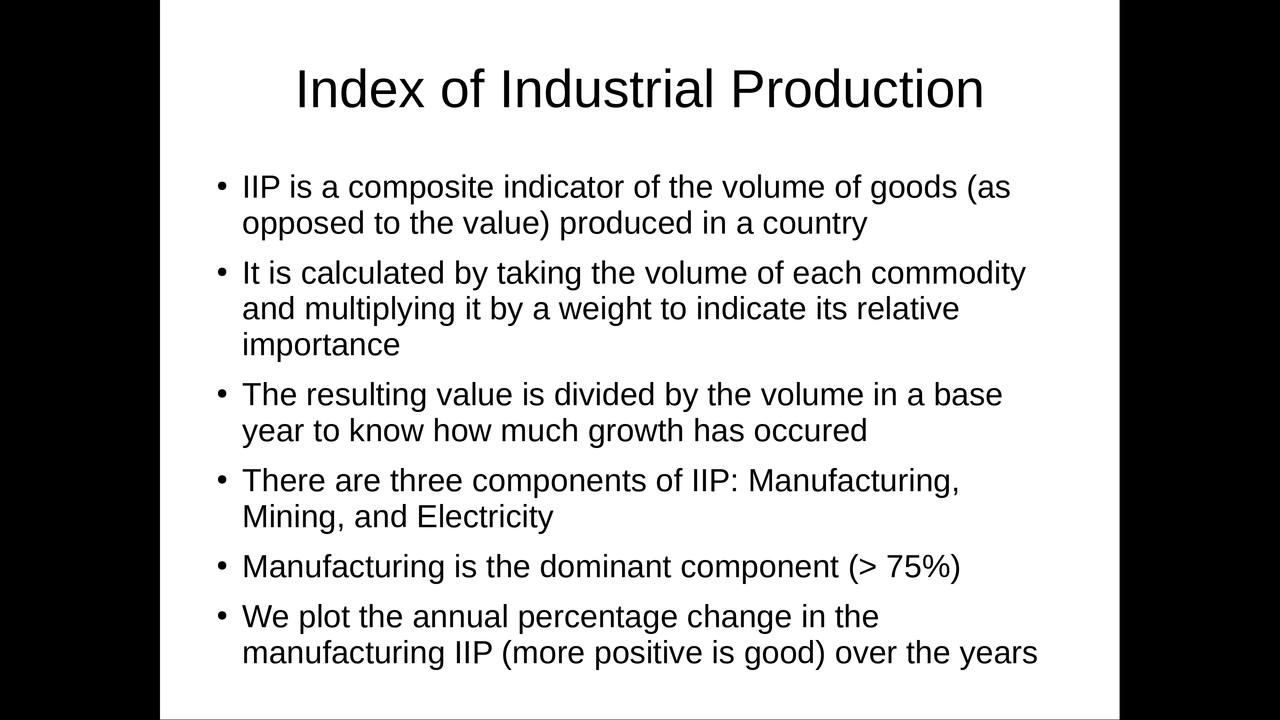
Index of Industrial Production
10 / 120
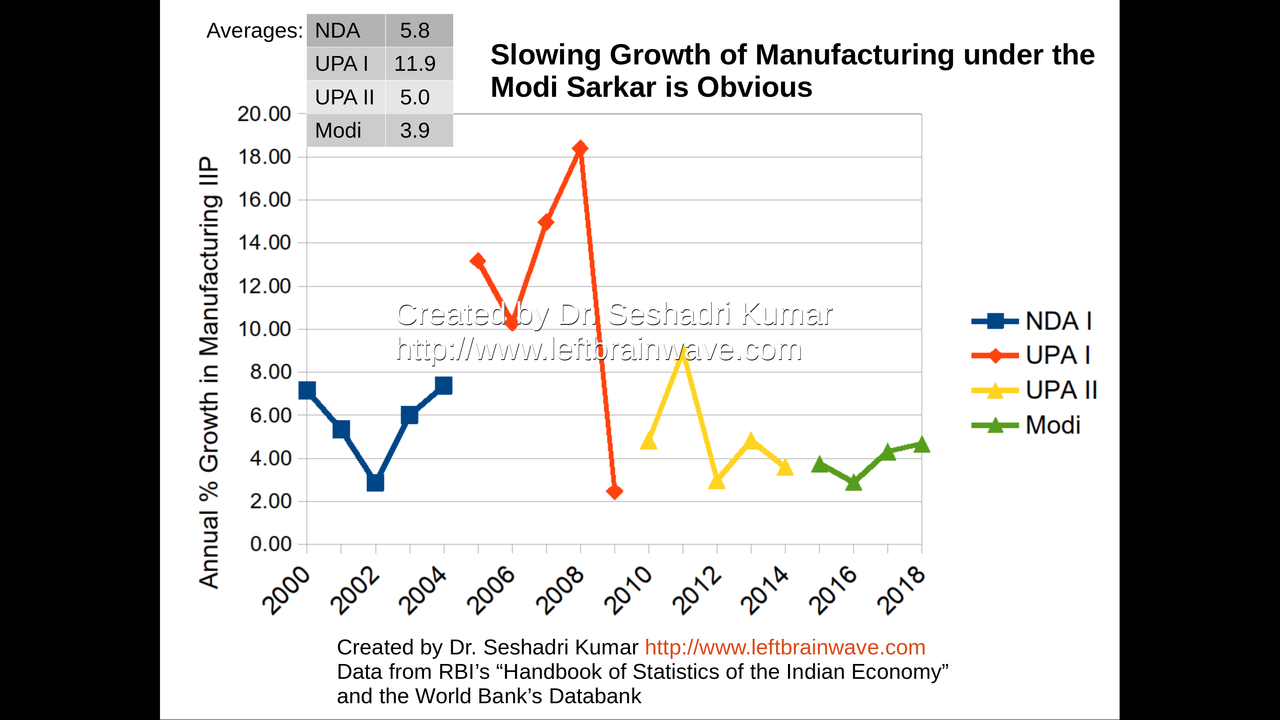
Growth in IIP for Manufacturing for Different Regimes
11 / 120
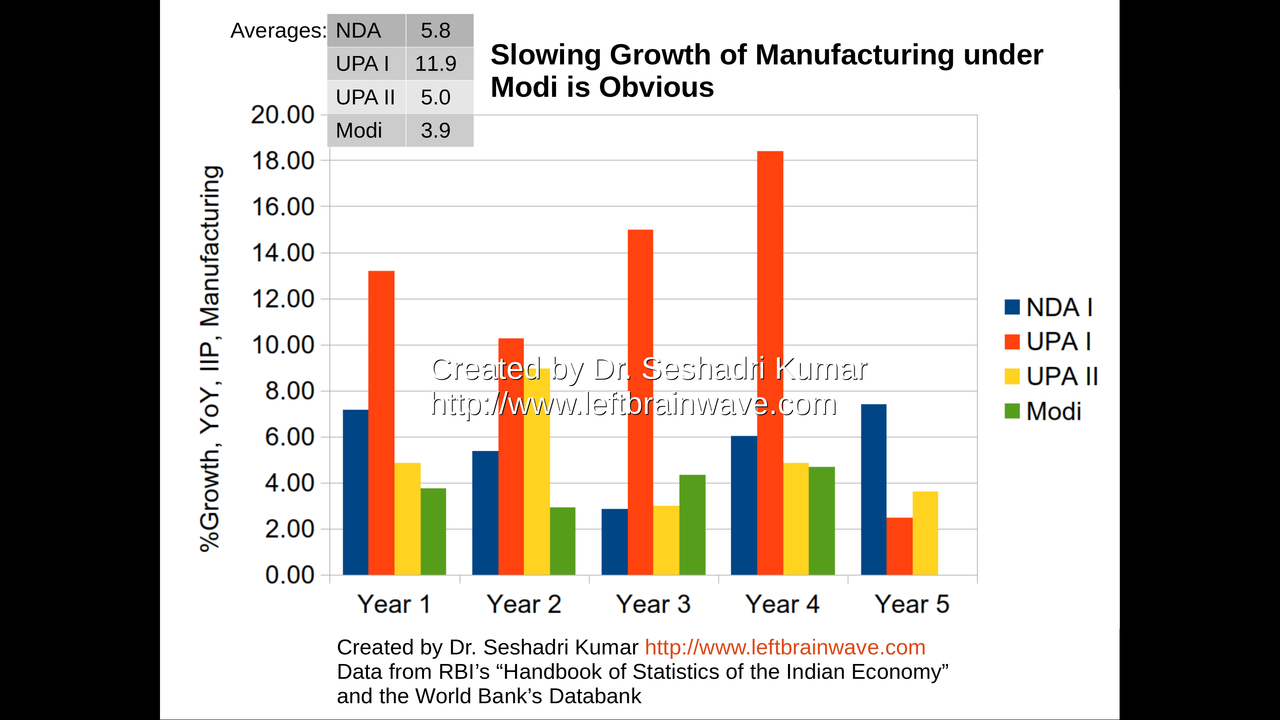
Growth in IIP for Manufacturing for Different Regimes
12 / 120
Consumption of Finished Steel
13 / 120
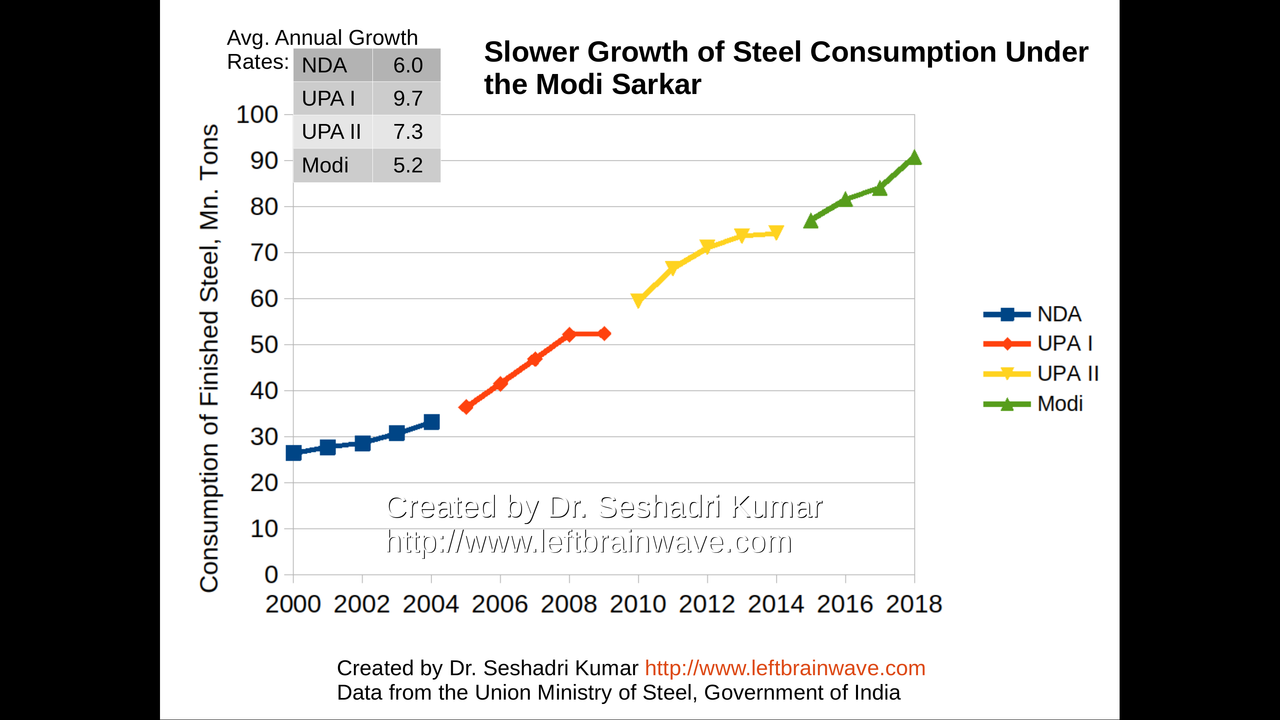
Growth Rate of Steel Consumption for Different Regimes
14 / 120
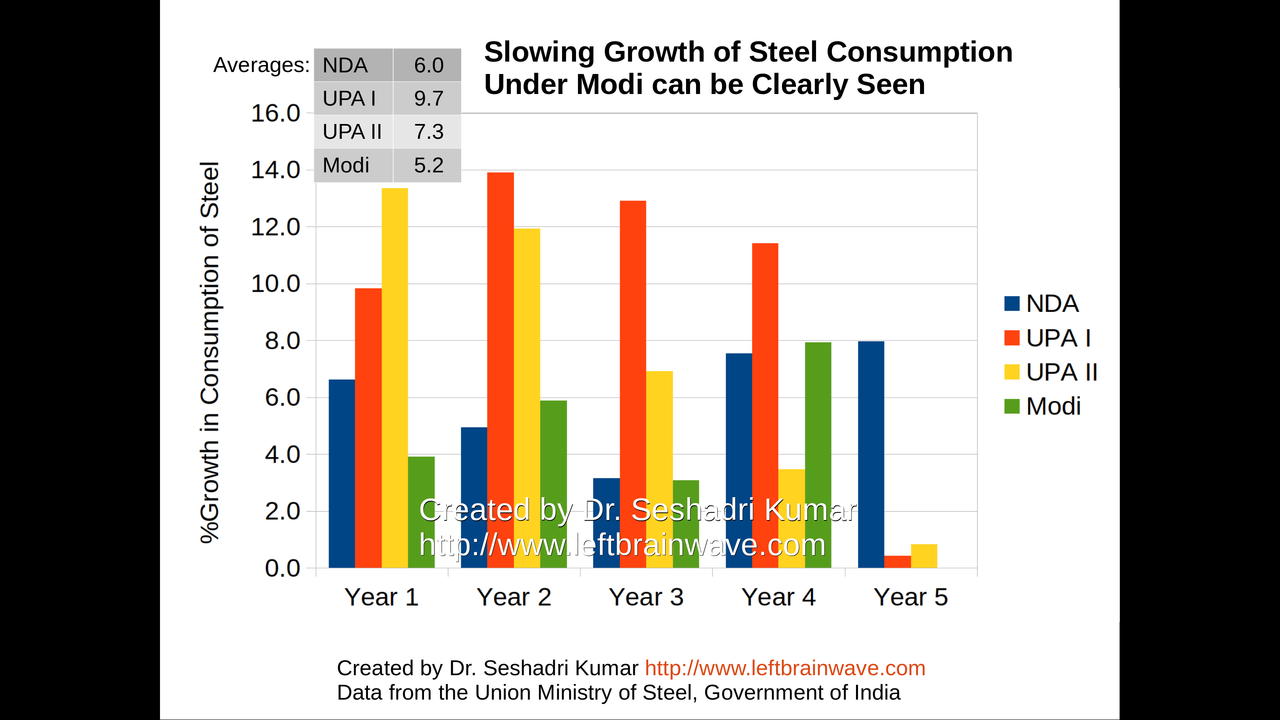
Growth Rate of Steel Consumption for Different Regimes
15 / 120
Container Port Traffic
16 / 120
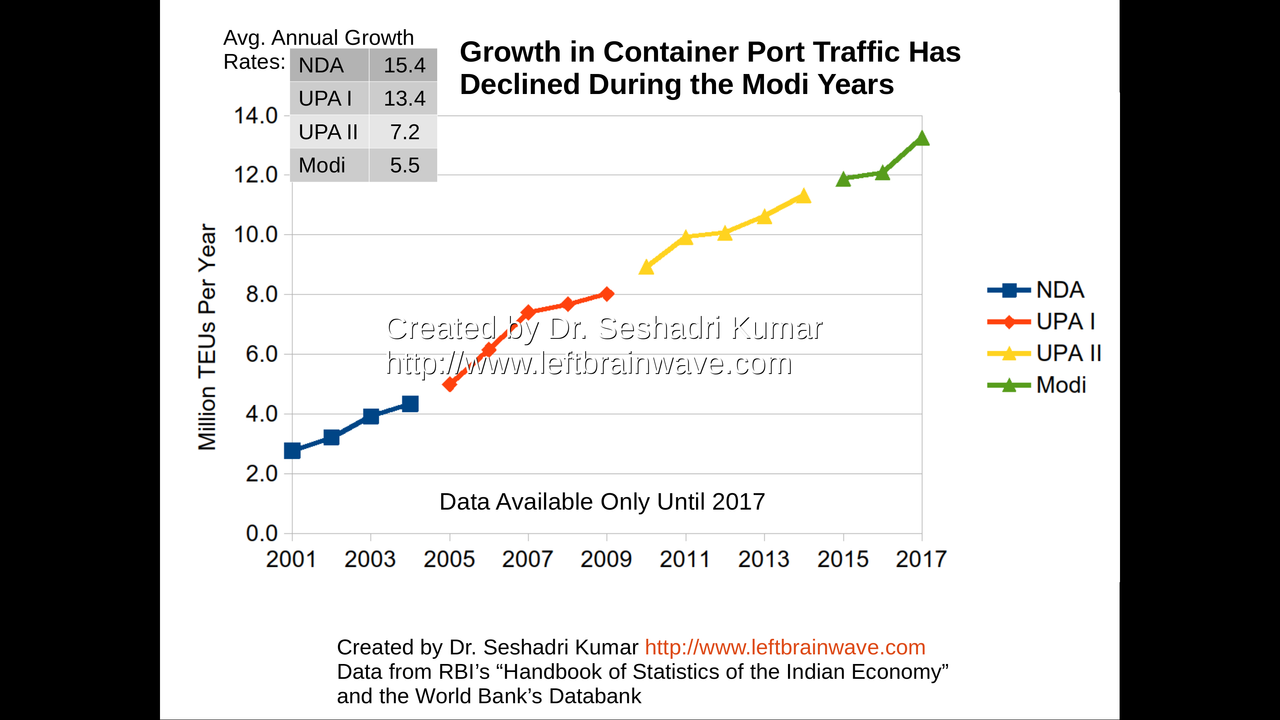
Container Port Traffic Growth for Different Regimes
17 / 120
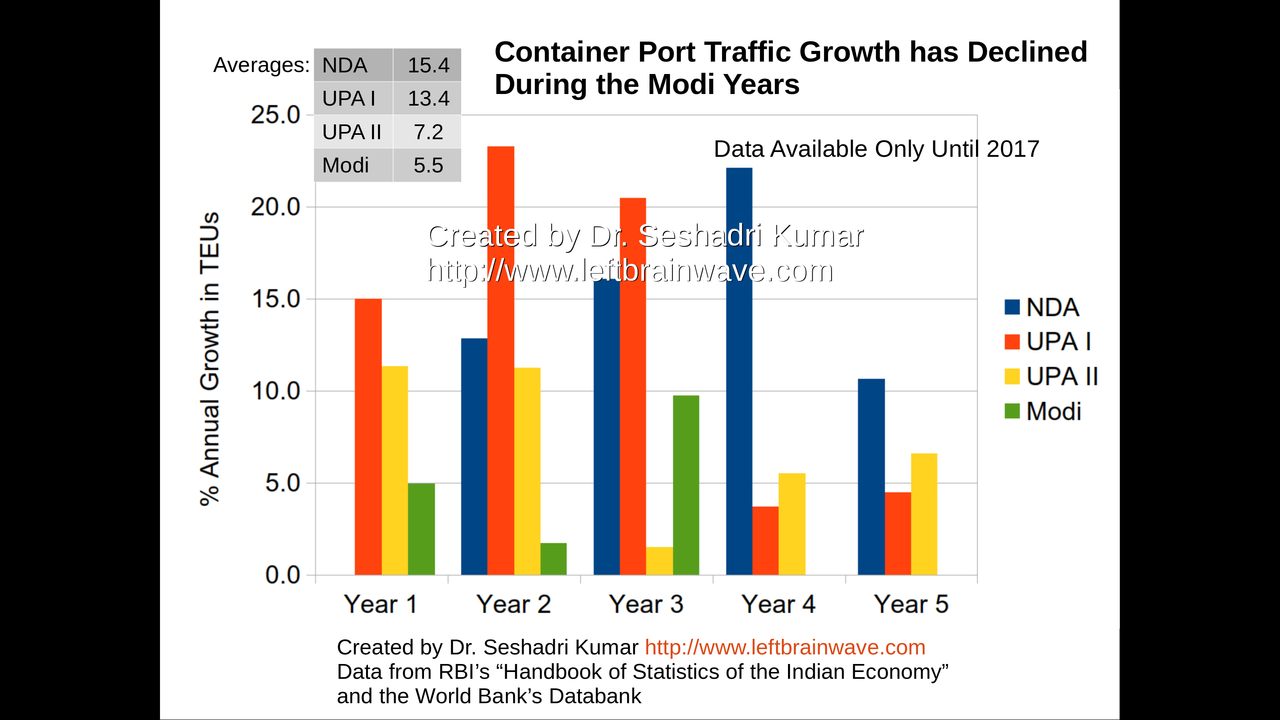
Container Port Traffic Growth for Different Regimes
18 / 120
Railway Freight Tonnage
19 / 120
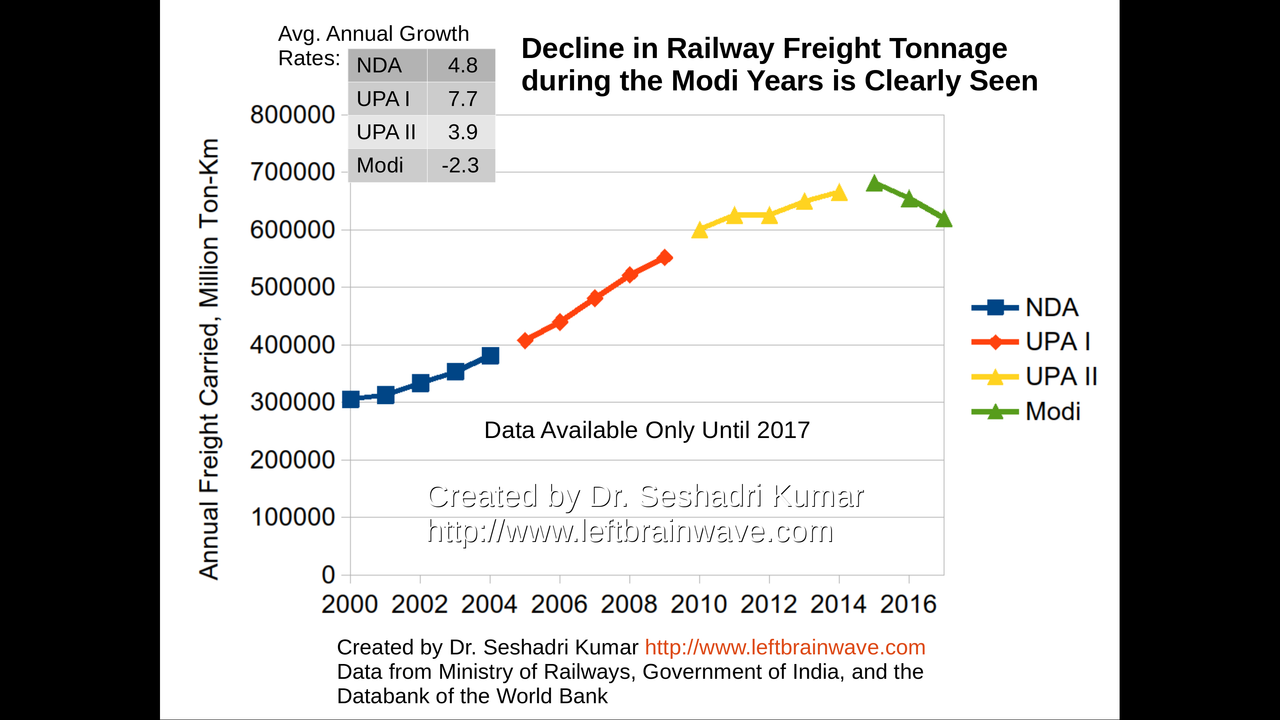
Growth in Railway Freight Tonnage for Different Regimes
20 / 120
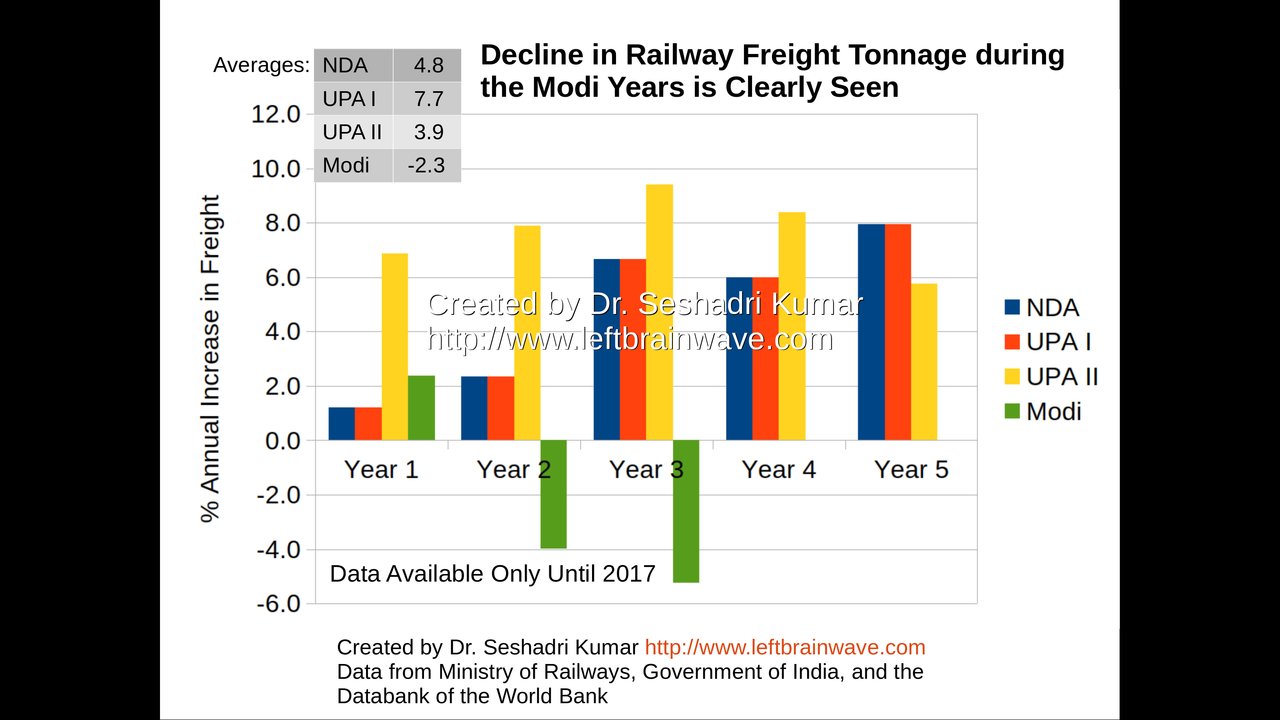
Growth in Railway Freight Tonnage for Different Regimes
21 / 120

Summary: Industrial Productivity and Output
22 / 120

Agricultural Output
23 / 120
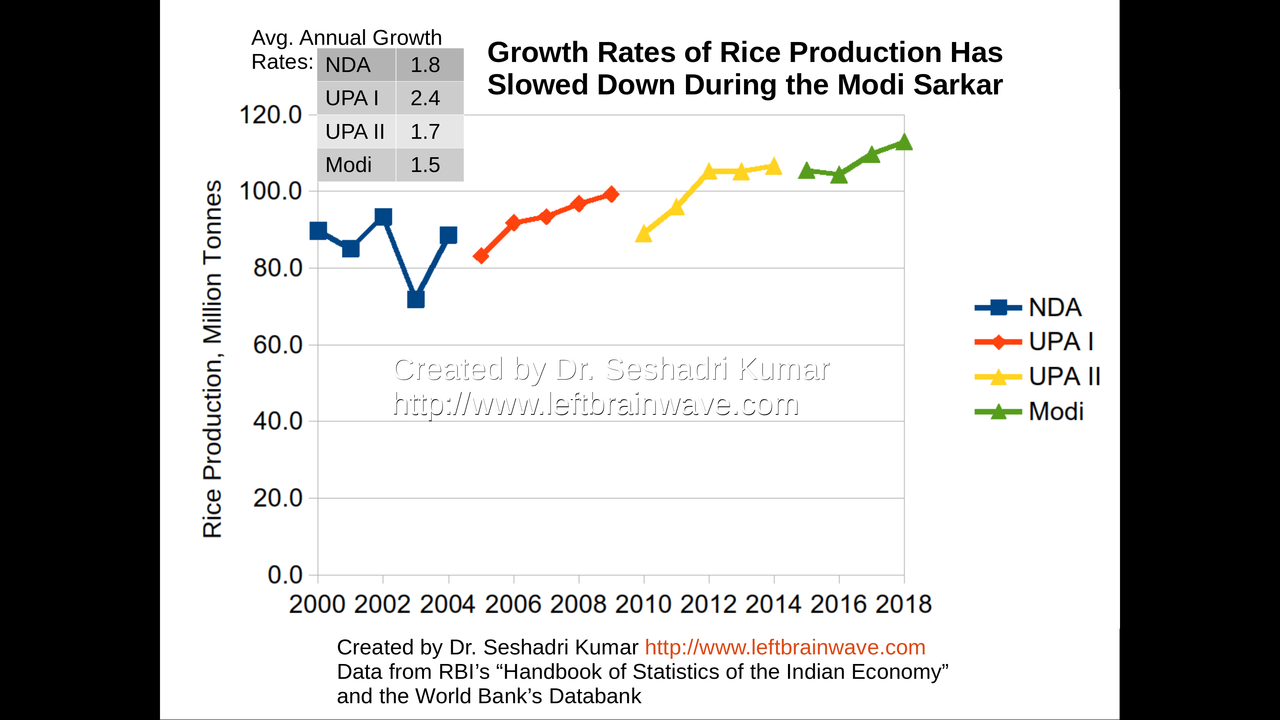
Annual Growth in Rice Production for Different Regimes
24 / 120
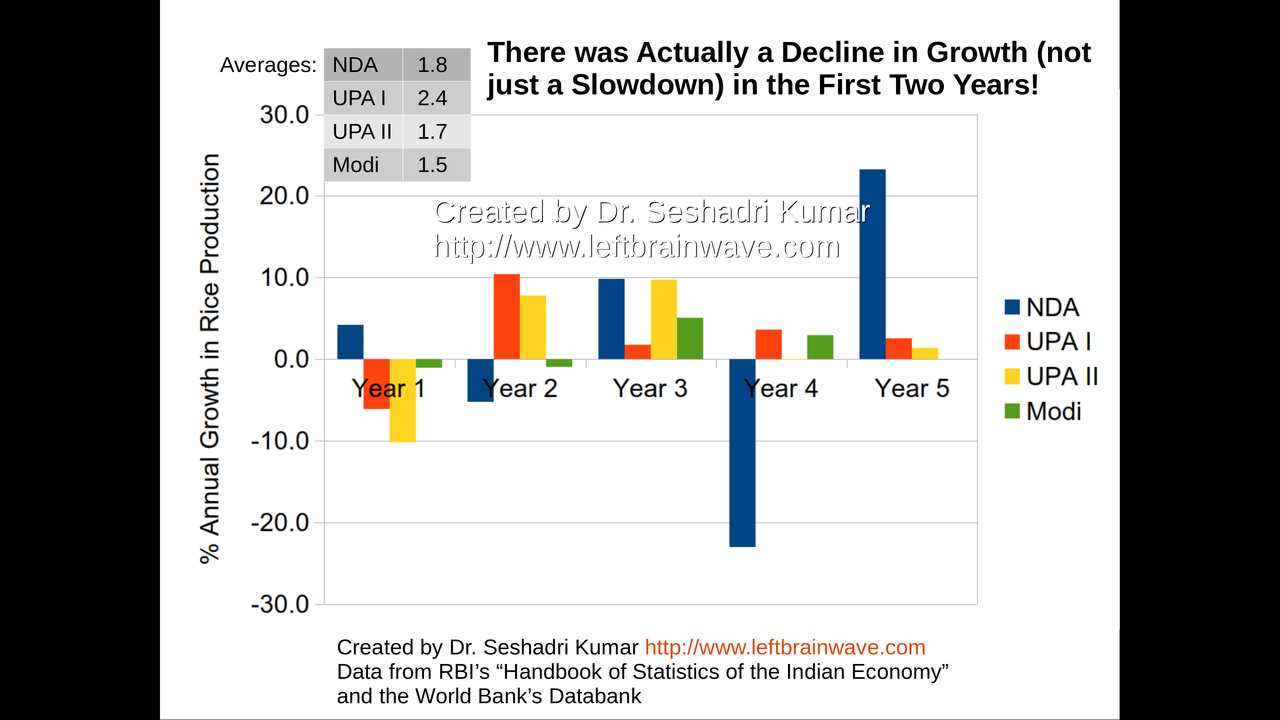
Annual Growth in Rice Production for Different Regimes
25 / 120
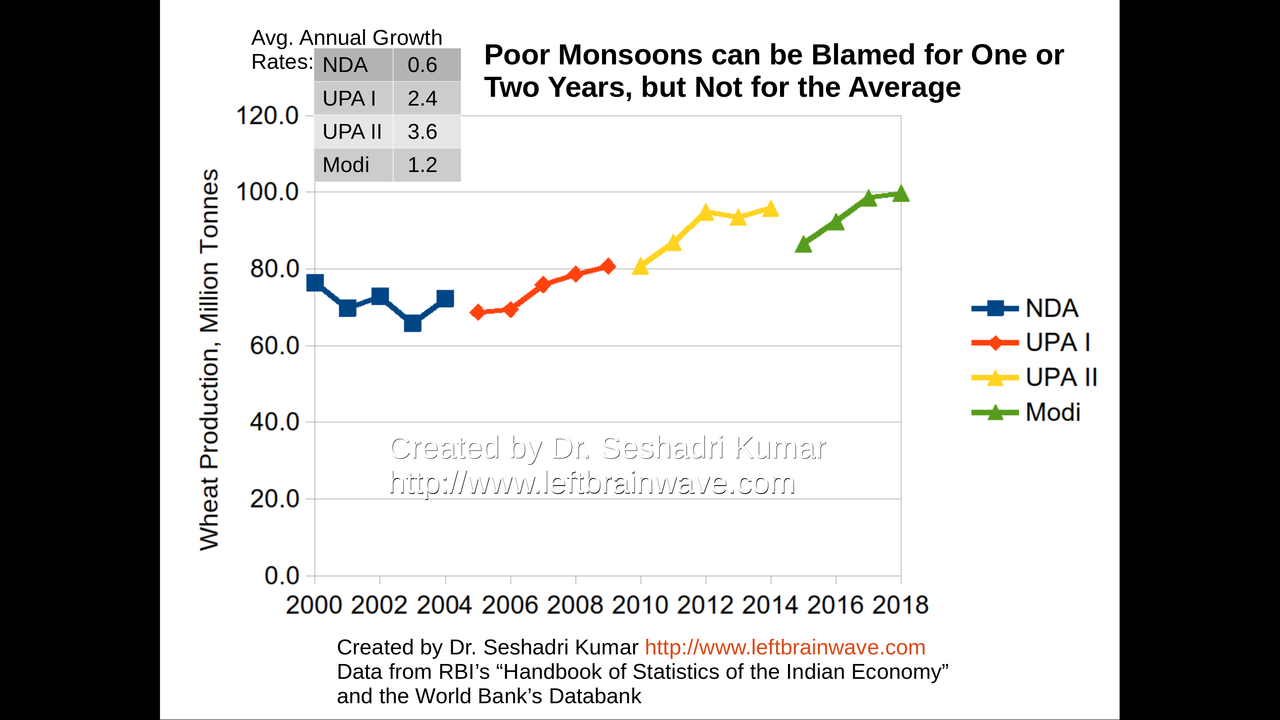
Annual Growth in Wheat Production for Different Regimes
26 / 120

Annual Growth in Wheat Production for Different Regimes
27 / 120
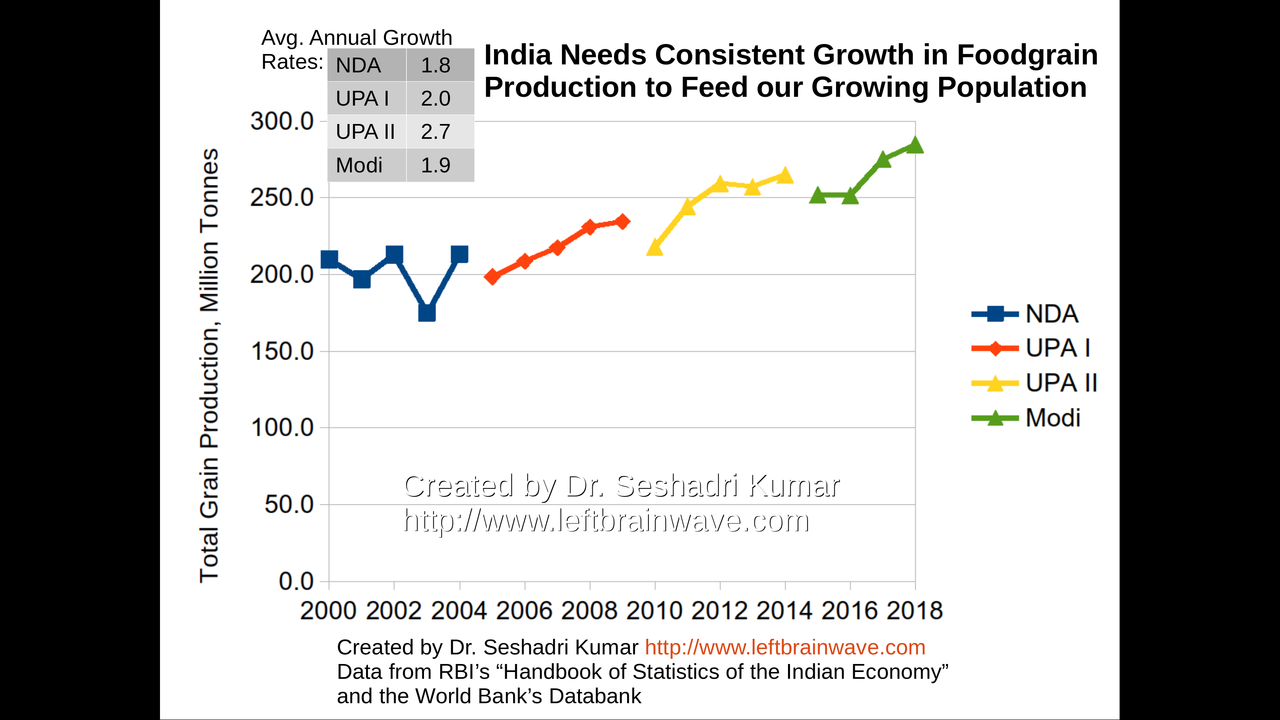
Annual Growth in Total Foodgrain Production for Various Regimes
28 / 120
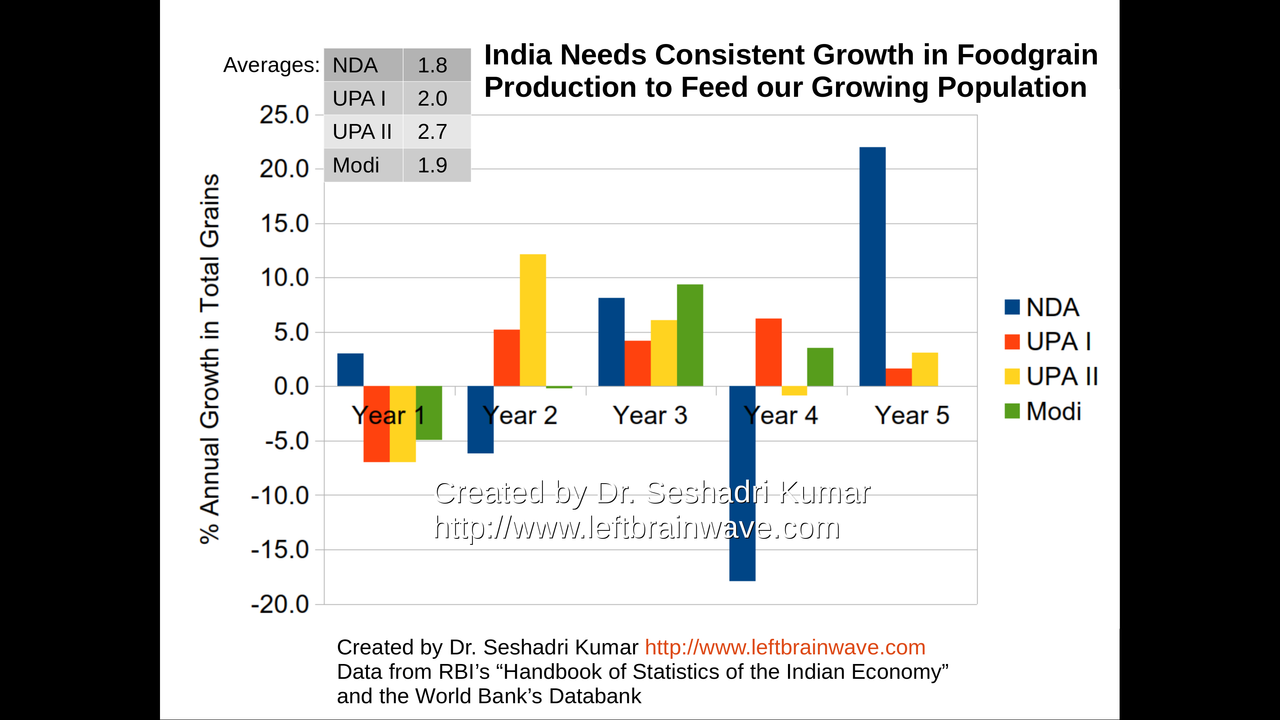
Annual Growth in Total Foodgrain Production for Various Regimes
29 /120
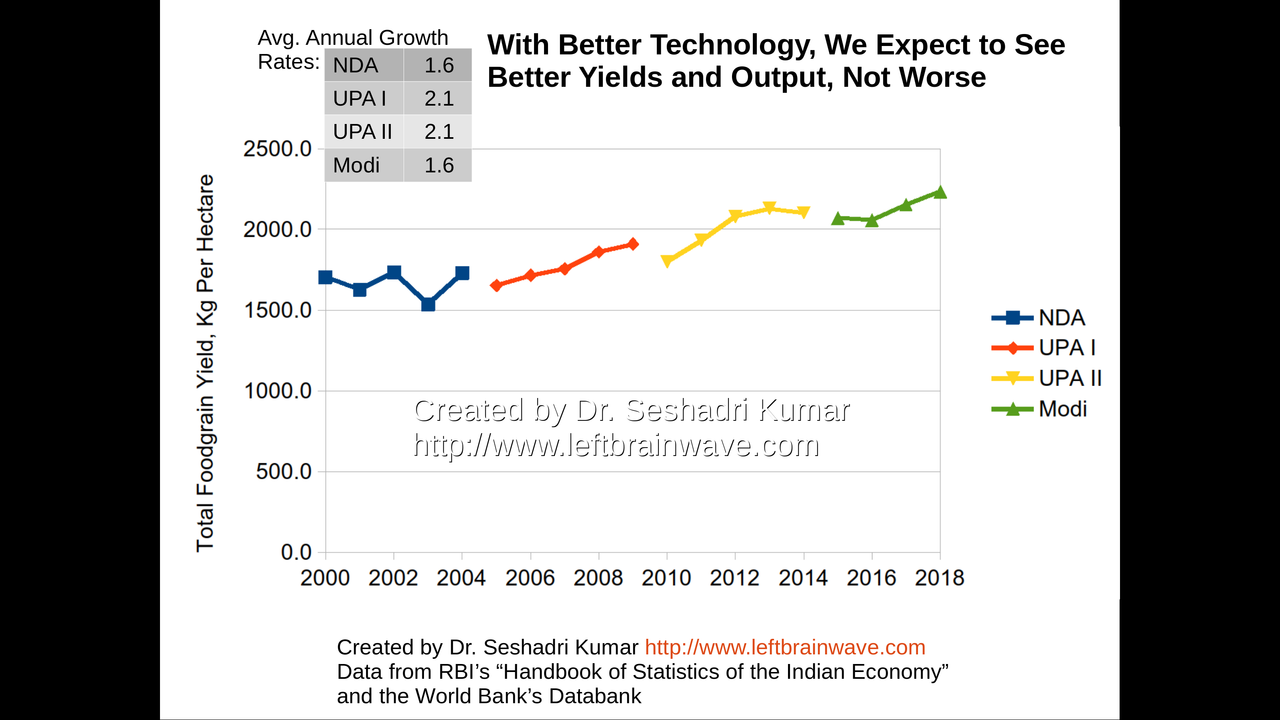
Growth in Foodgrain Yield for Different Regimes
30 / 120
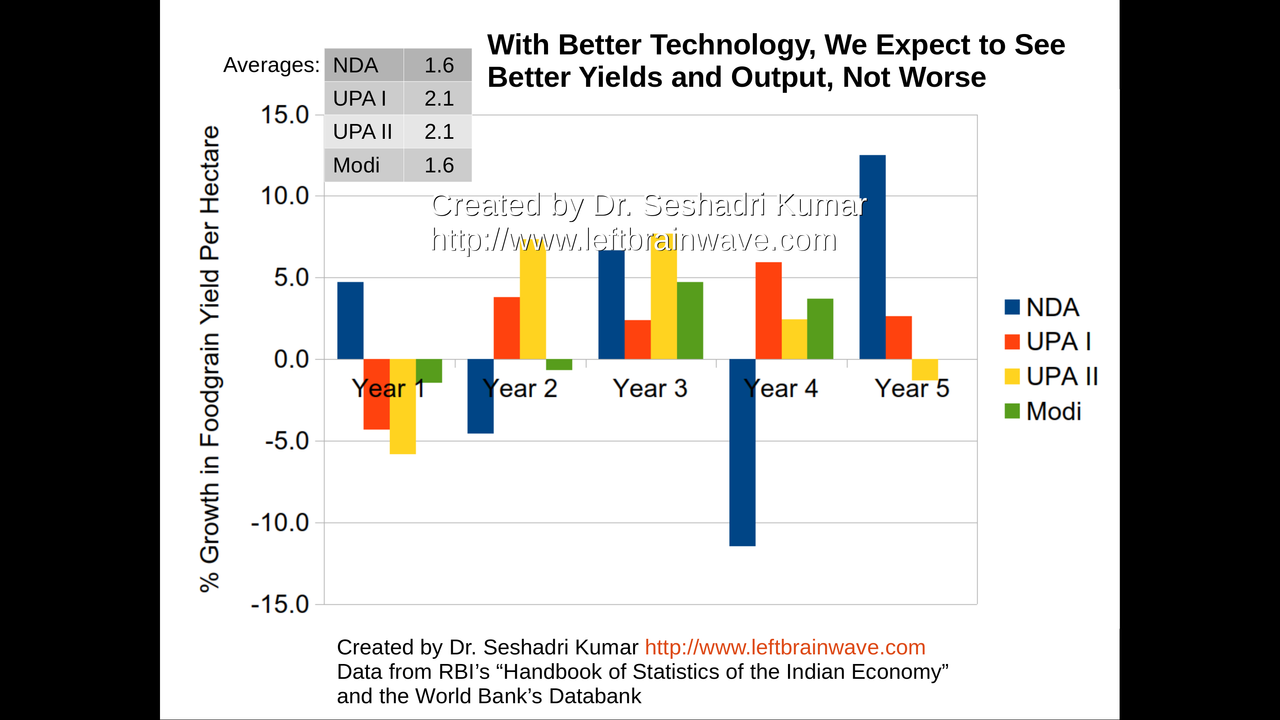
Growth in Foodgrain Yield for Different Regimes
31 / 120
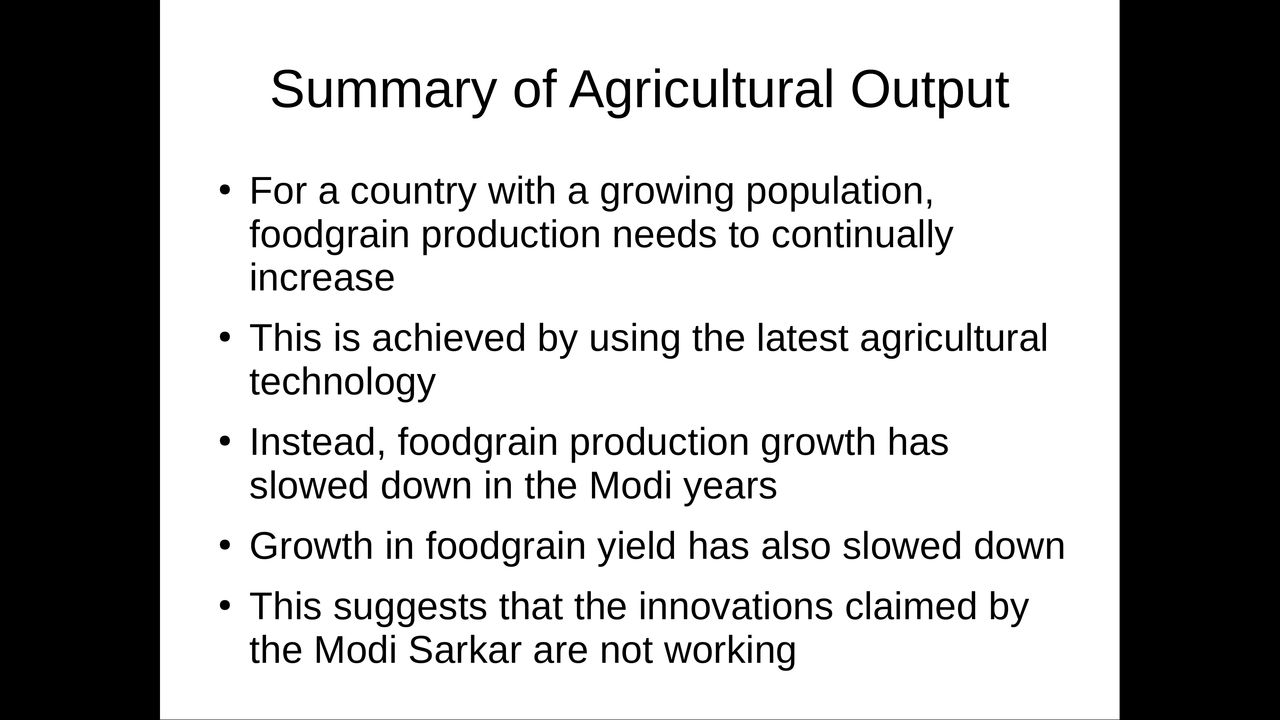
Summary: Agricultural Output Performance
32 / 120
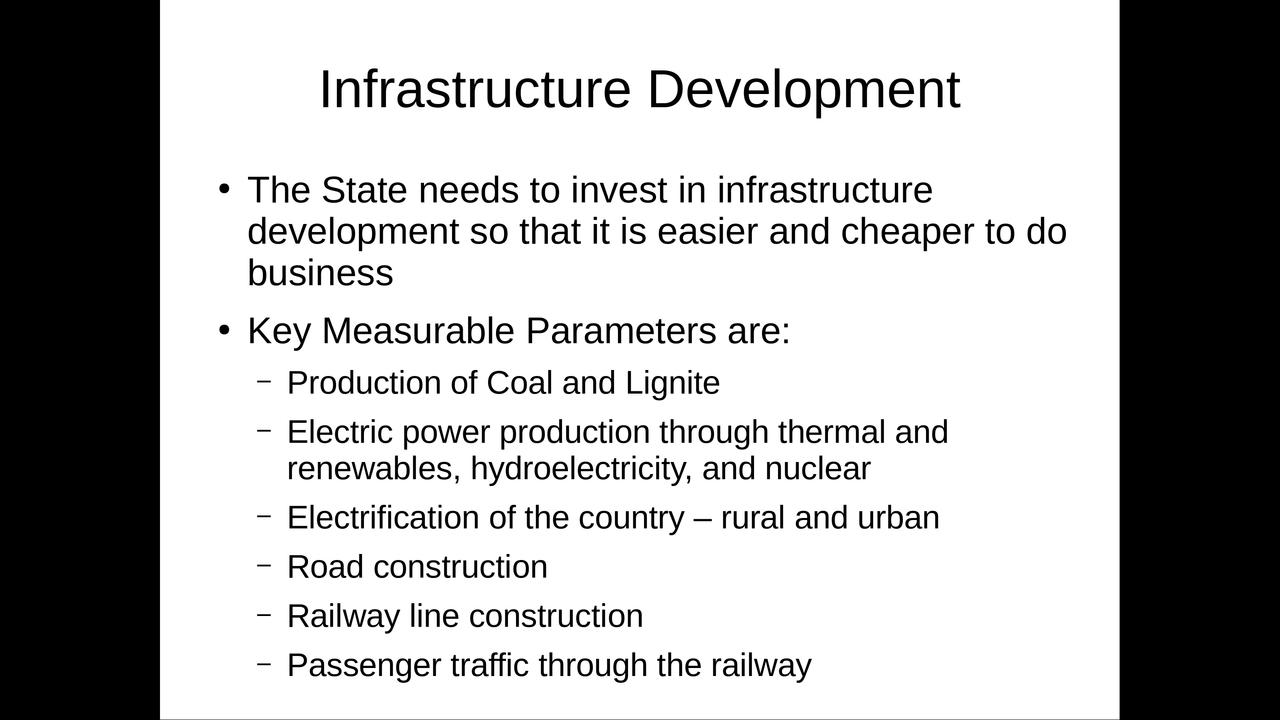
Infrastructure Development
33 / 120
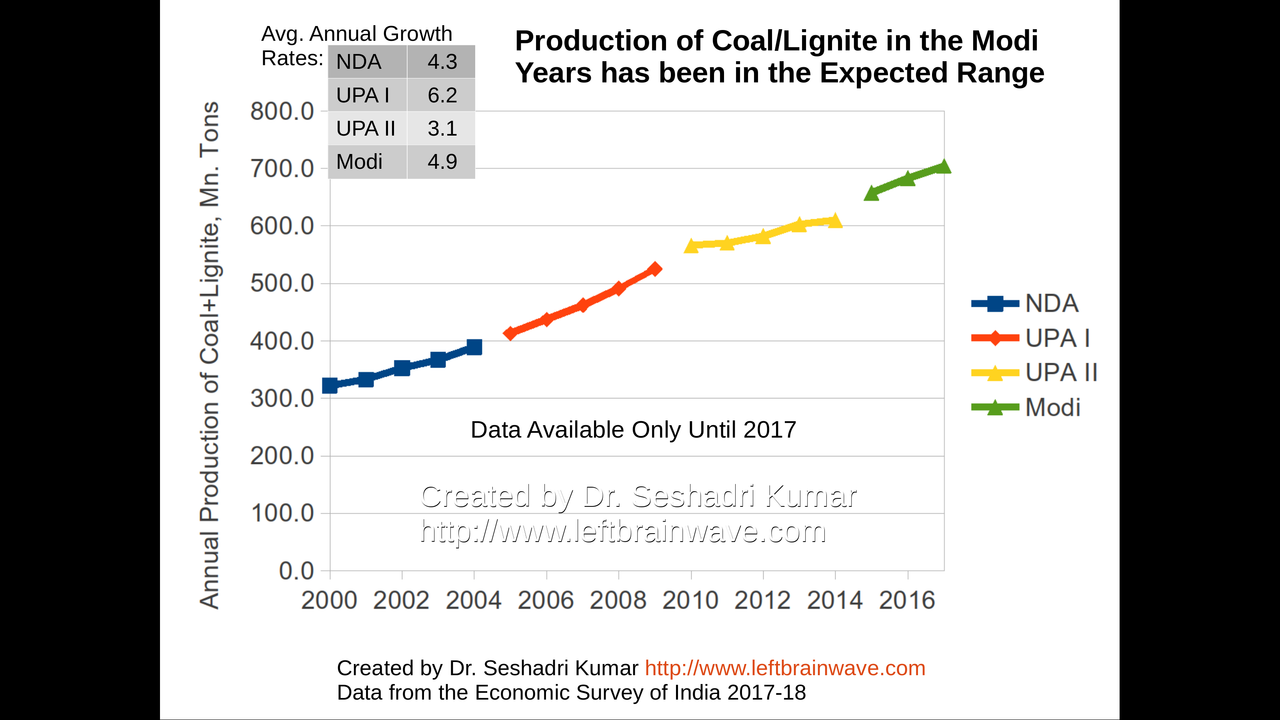
Growth in Production of Coal and Lignite
34 / 120
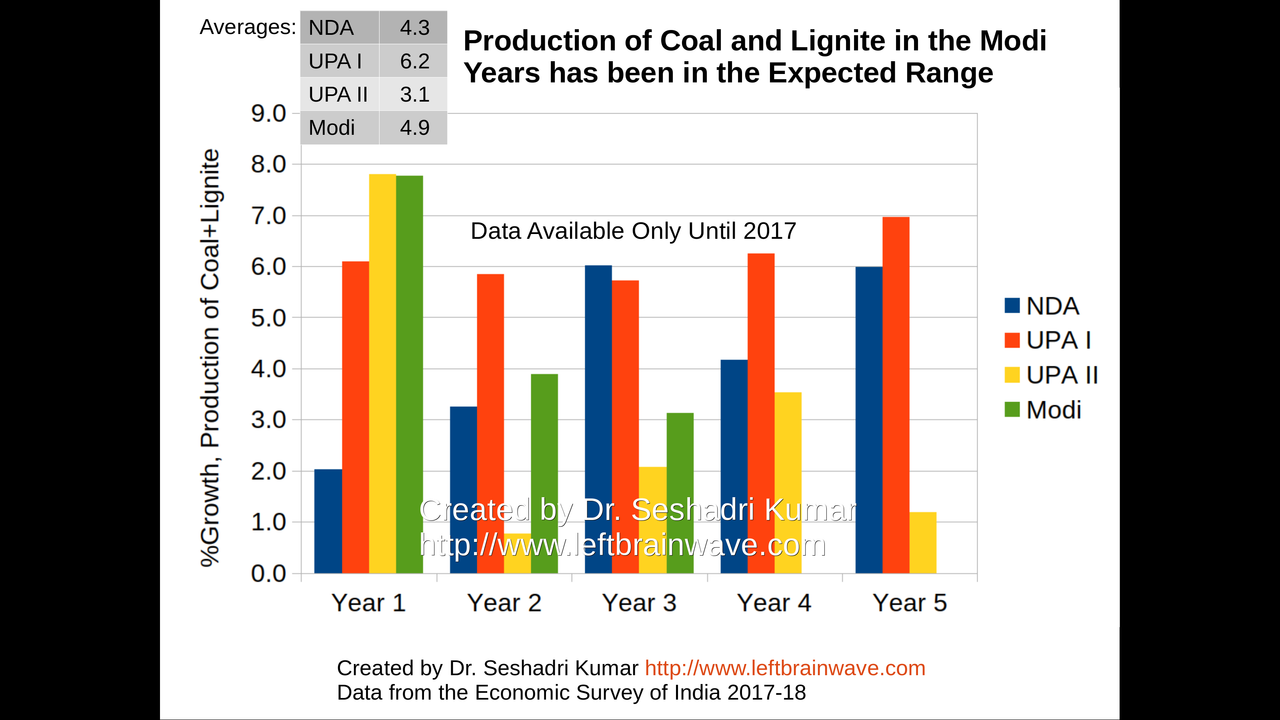
Growth in Production of Coal and Lignite
35 / 120
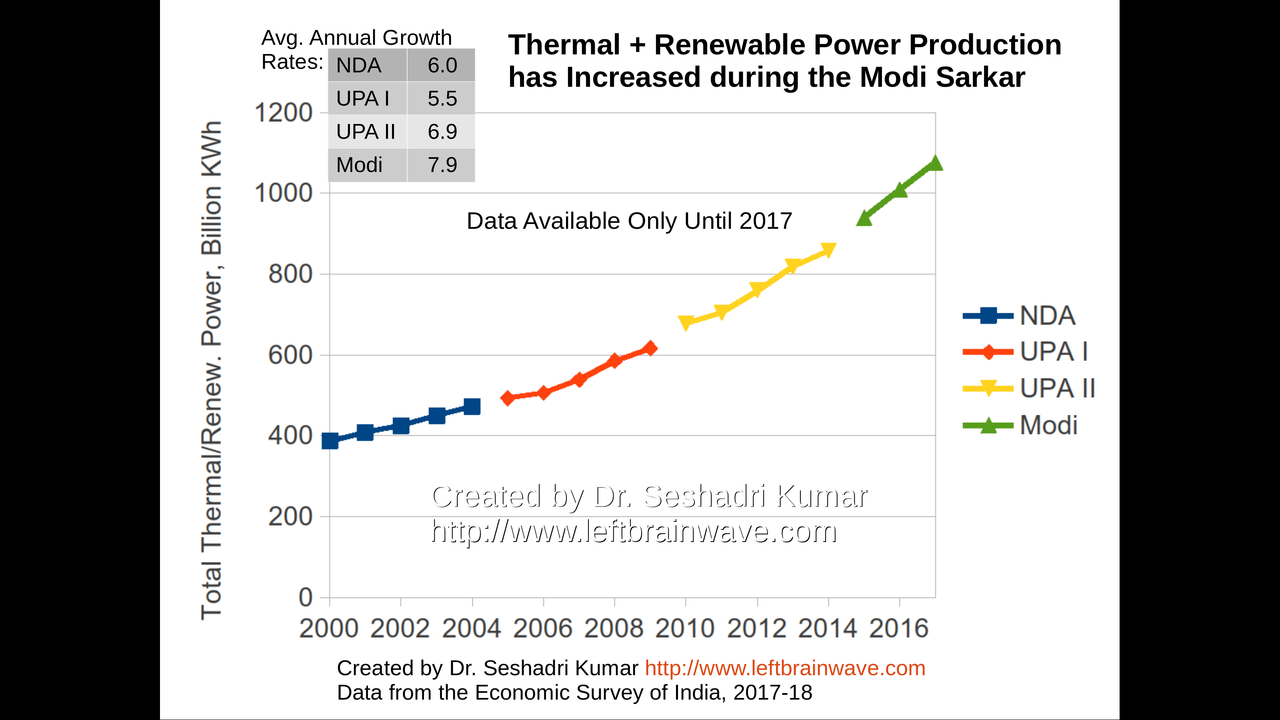
Growth in Thermal and Renewable Power Generation
36 / 120
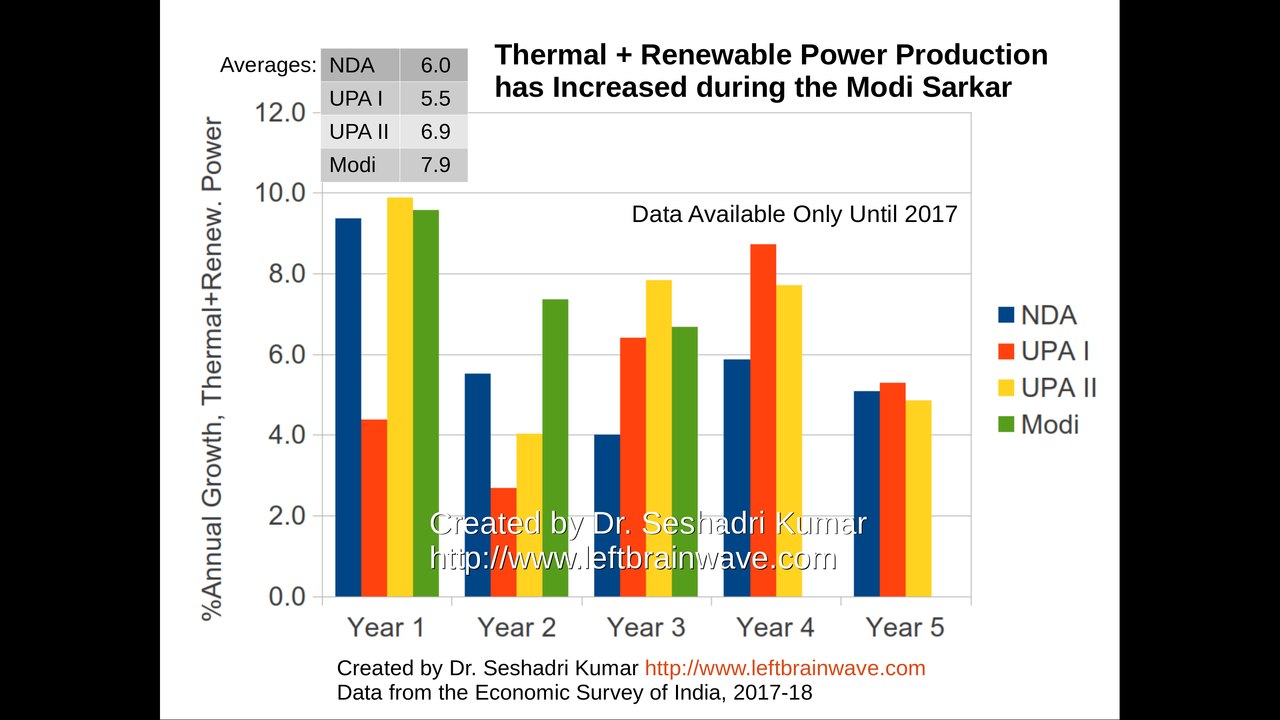
Growth in Thermal and Renewable Power Generation
37 / 120
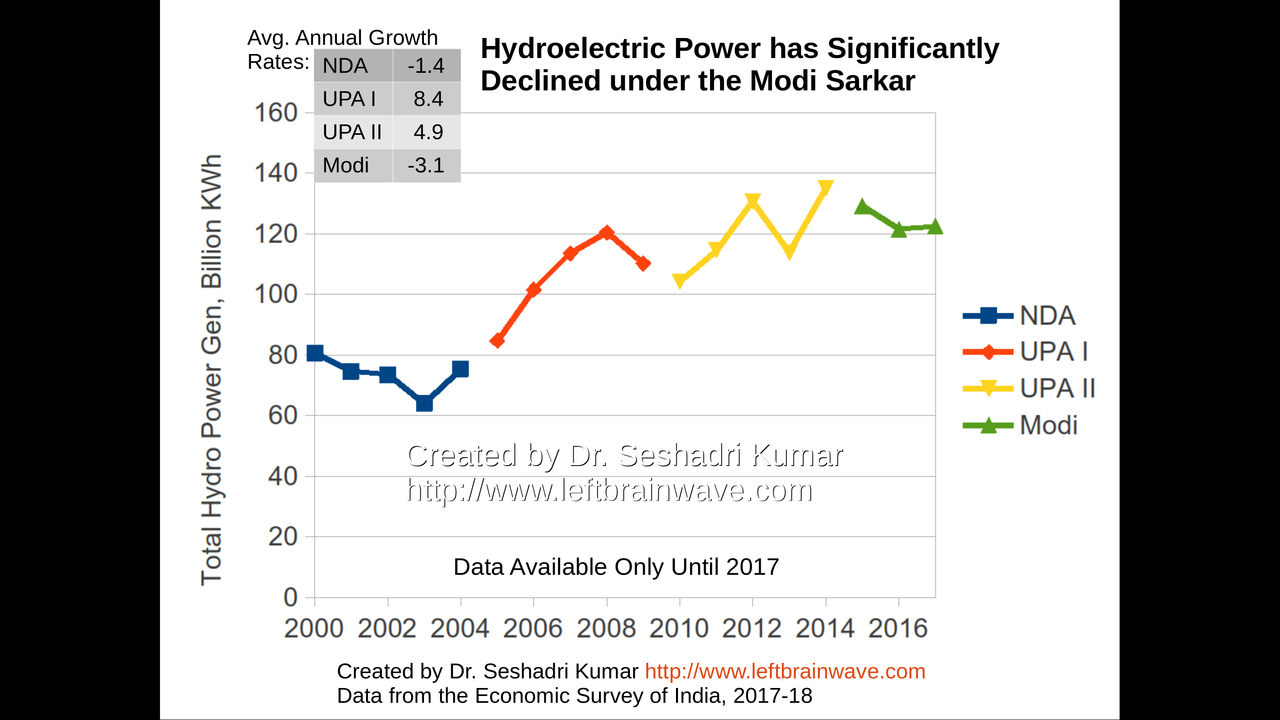
Growth in Hydroelectric Power Generation
38 / 120
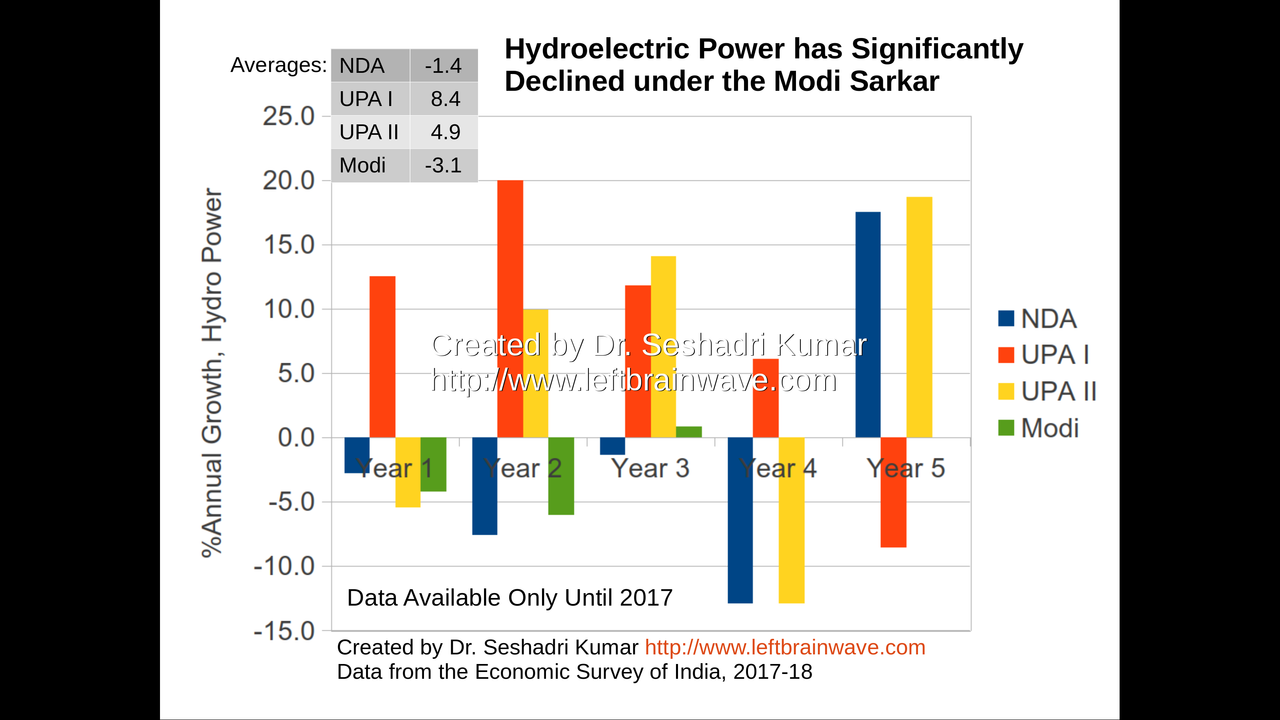
Growth in Hydroelectric Power Generation
39 / 120
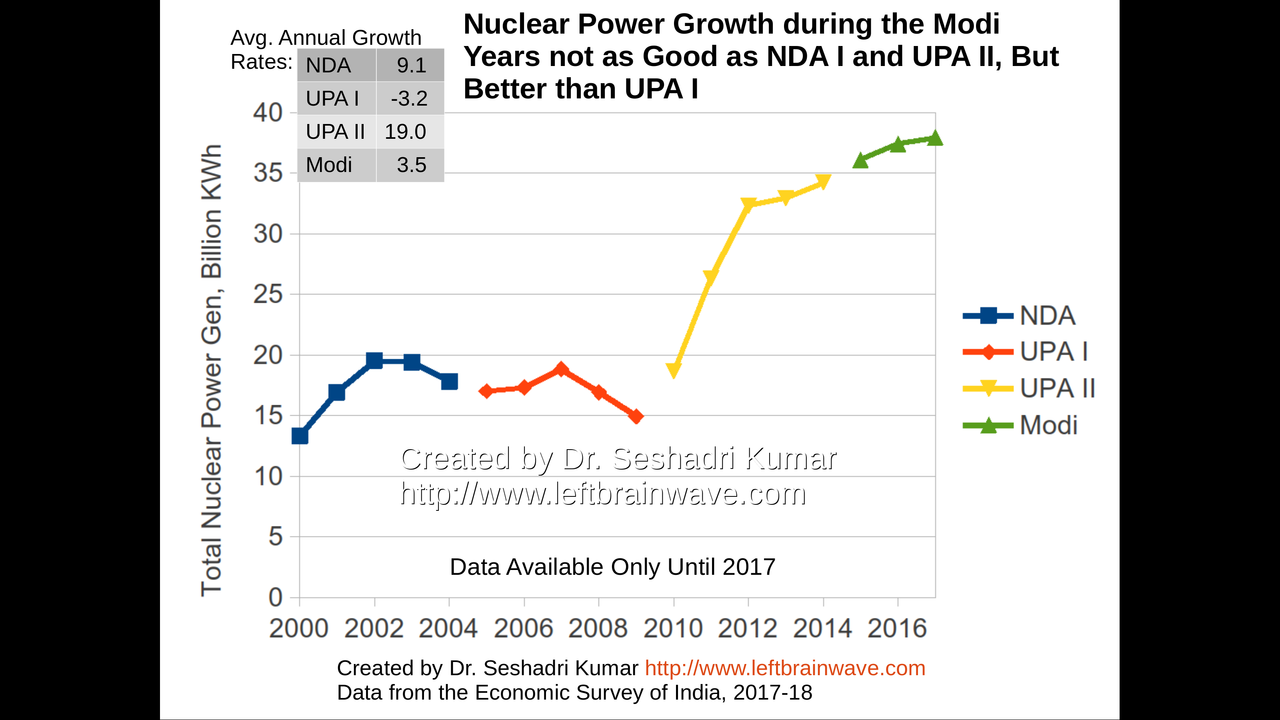
Growth in Nuclear Power Generation
40 / 120

Growth in Nuclear Power Generation
41 / 120
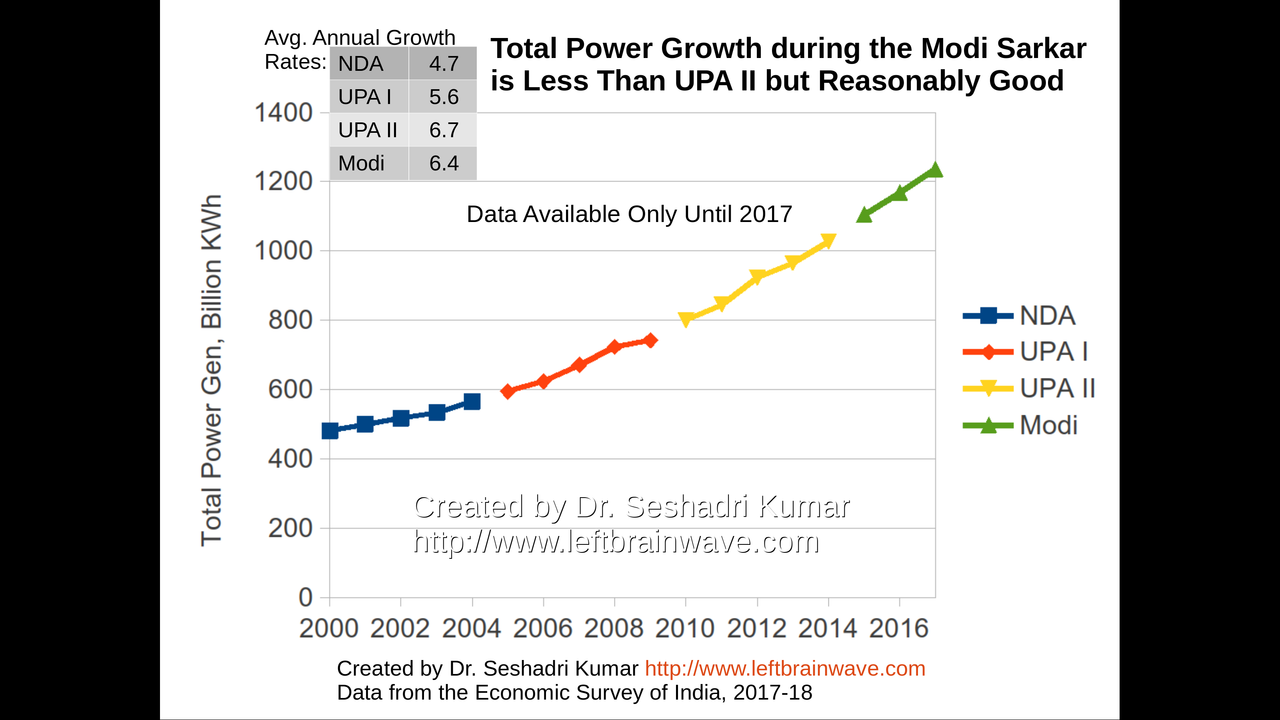
Growth in Total Power Generation
42 / 120
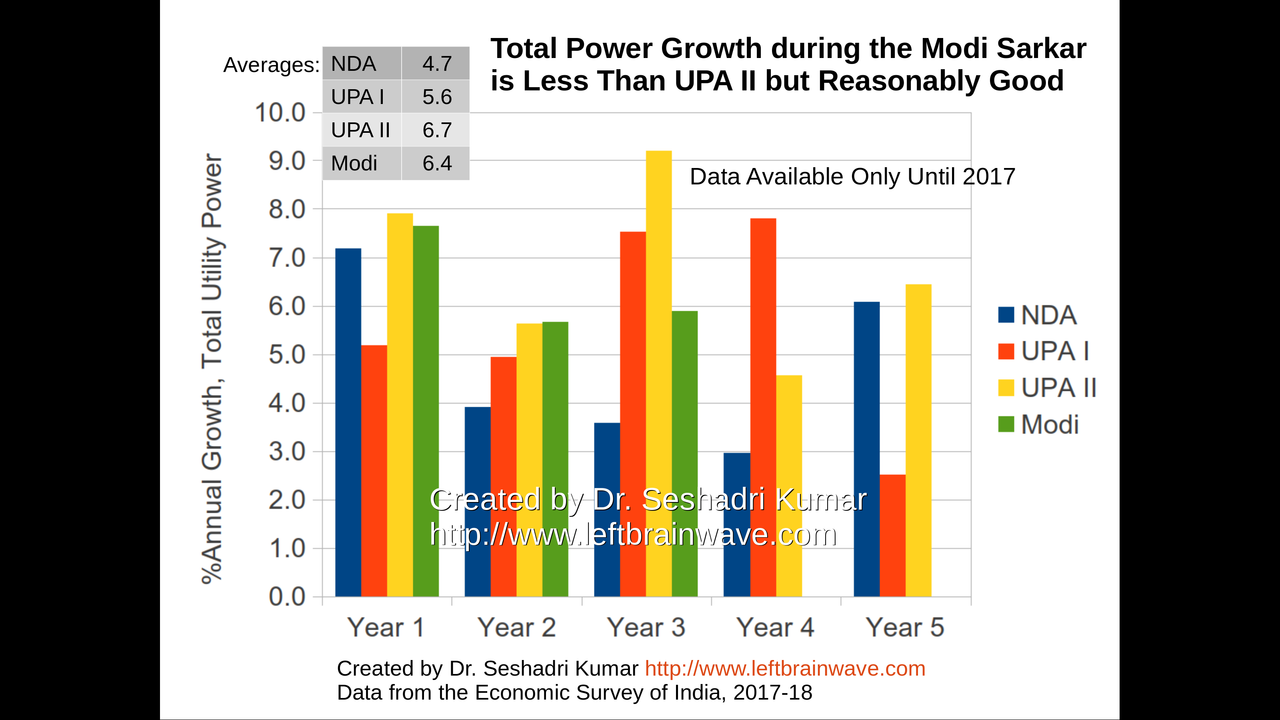
Growth in Total Power Generation
43 / 120
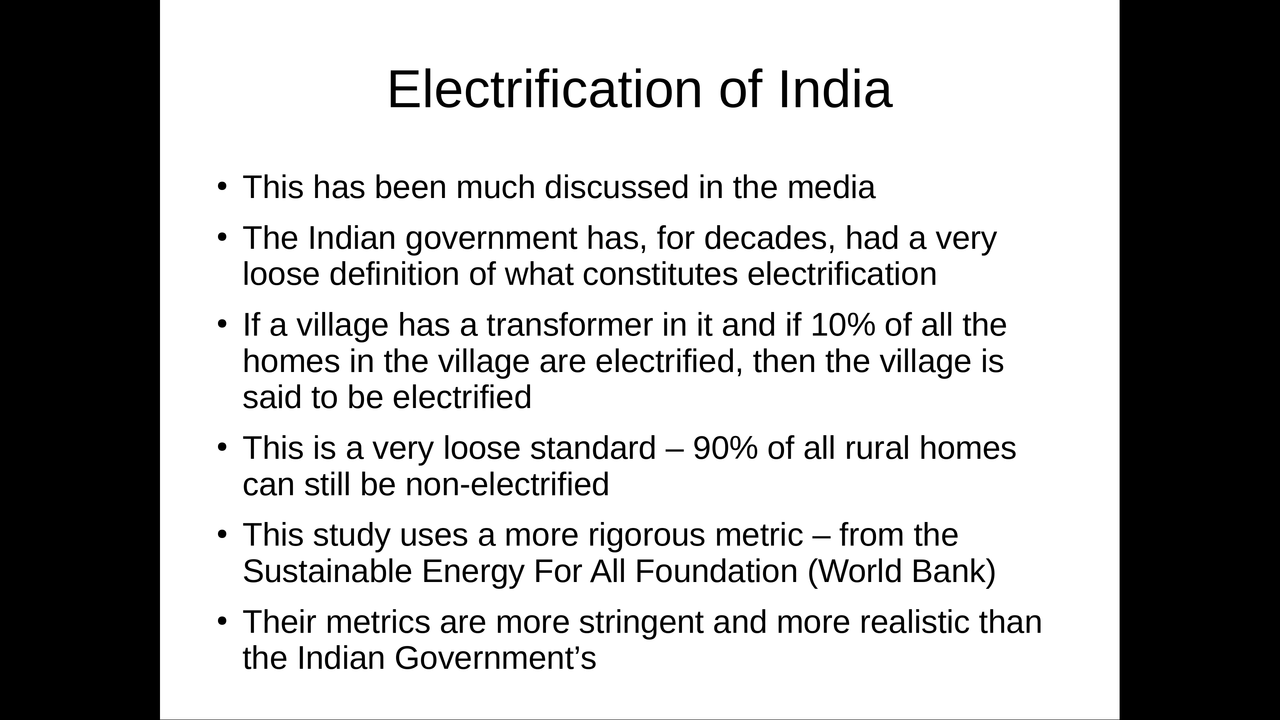
Rural and Urban Electrification
44 / 120
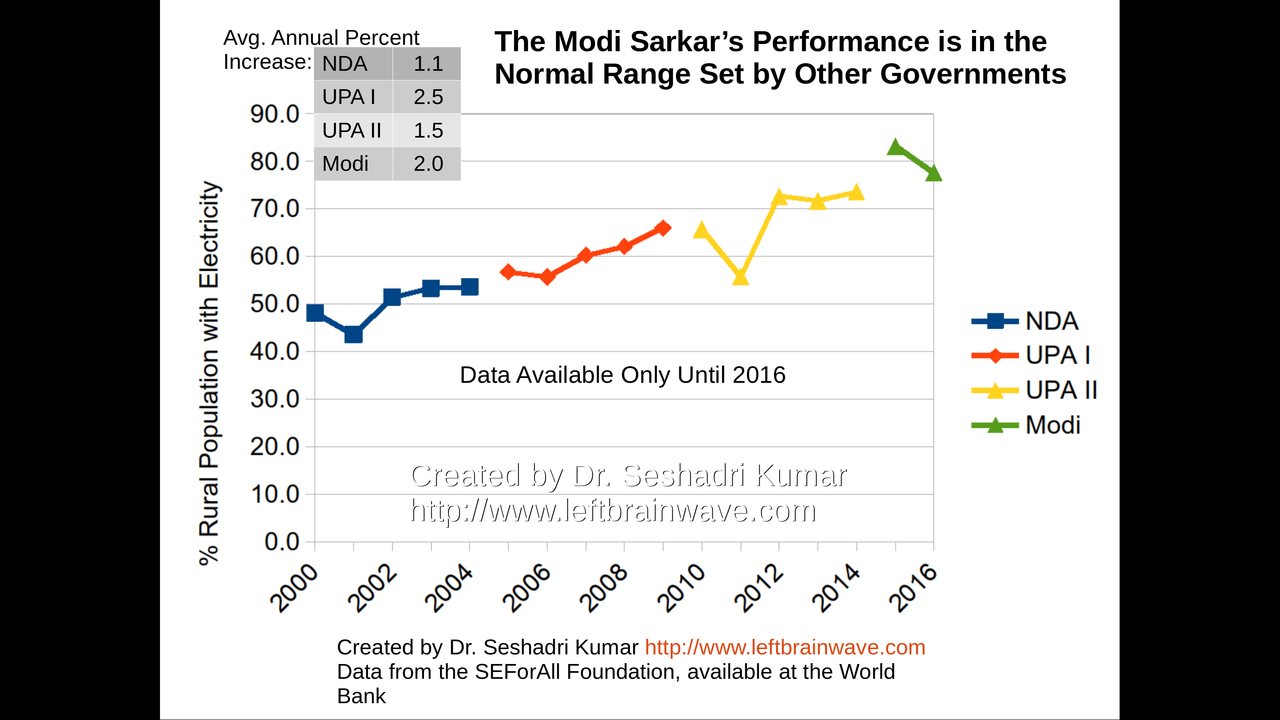
Growth in Rural Electrification
45 / 120
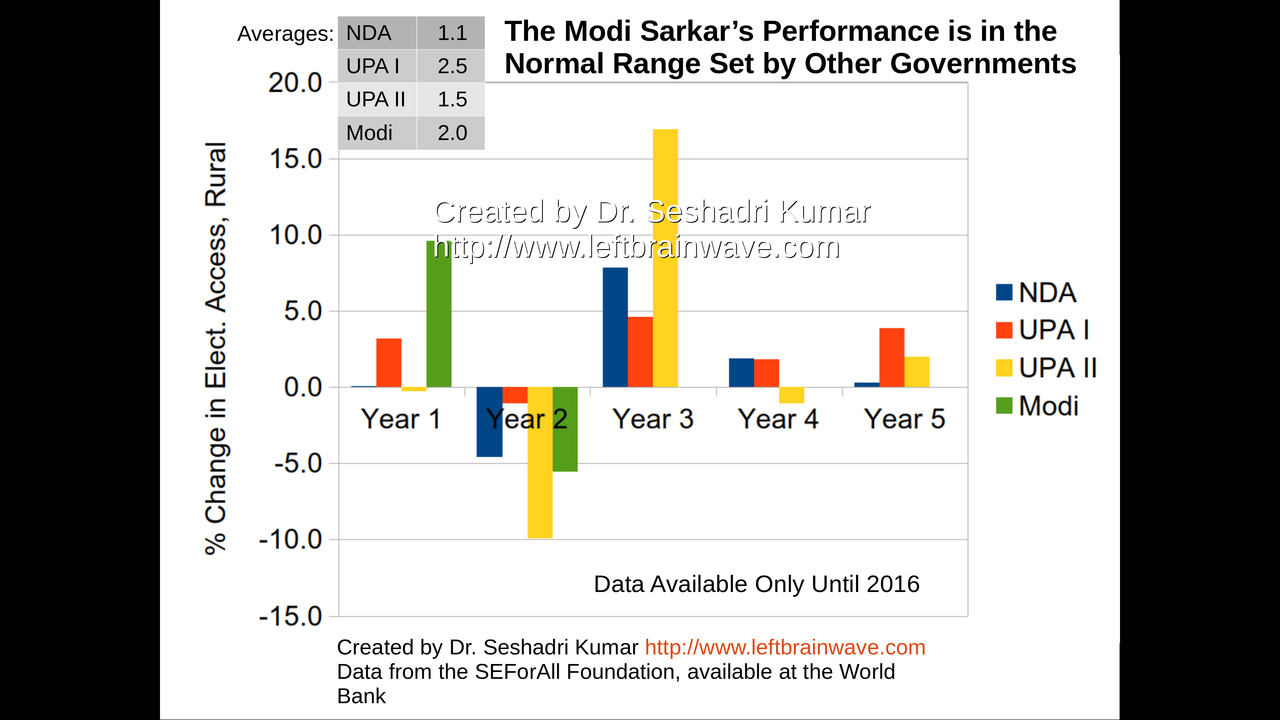
Growth in Rural Electrification
46 / 120
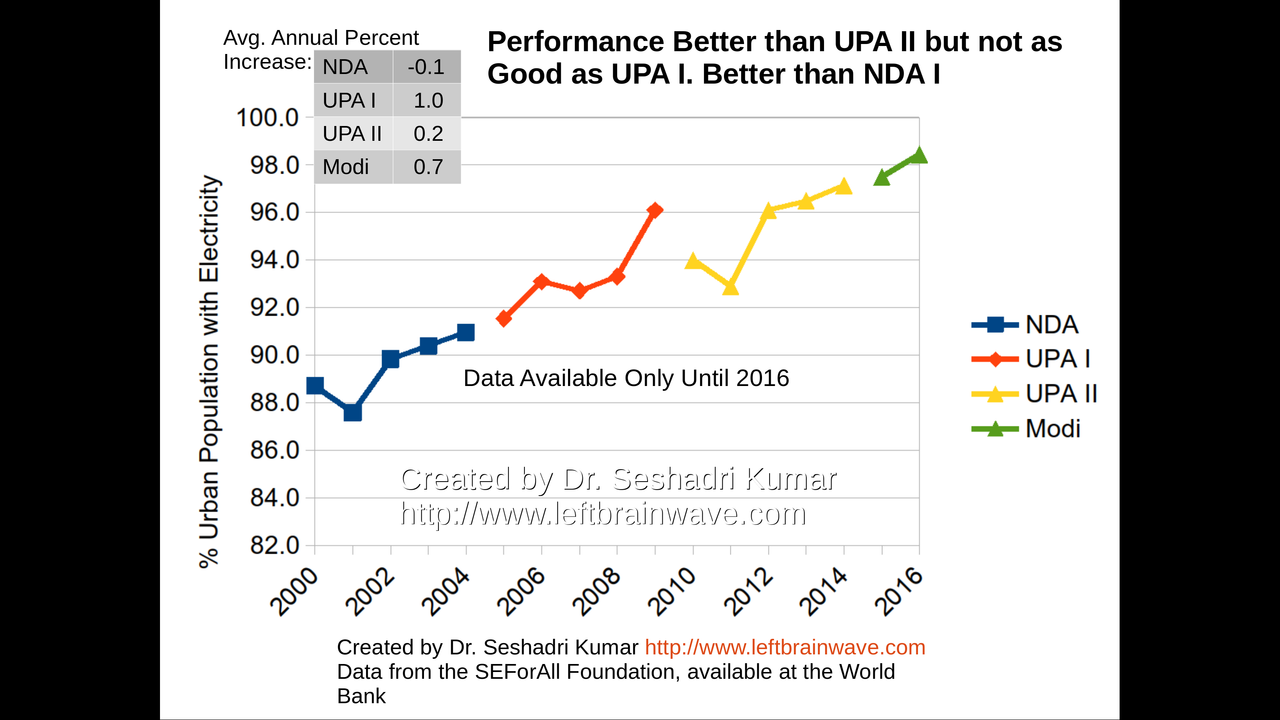
Growth in Urban Electrification
47 / 120

Growth in Urban Electrification
48 / 120
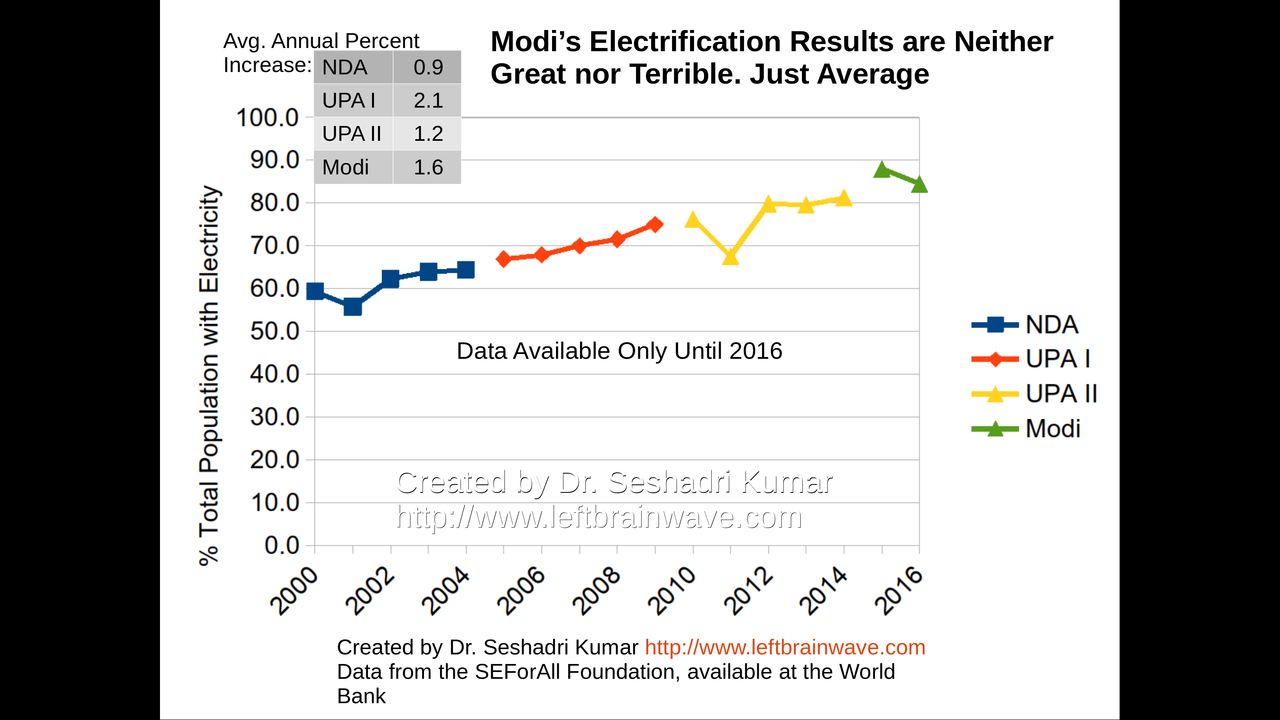
Growth in Overall Electrification
49 / 120
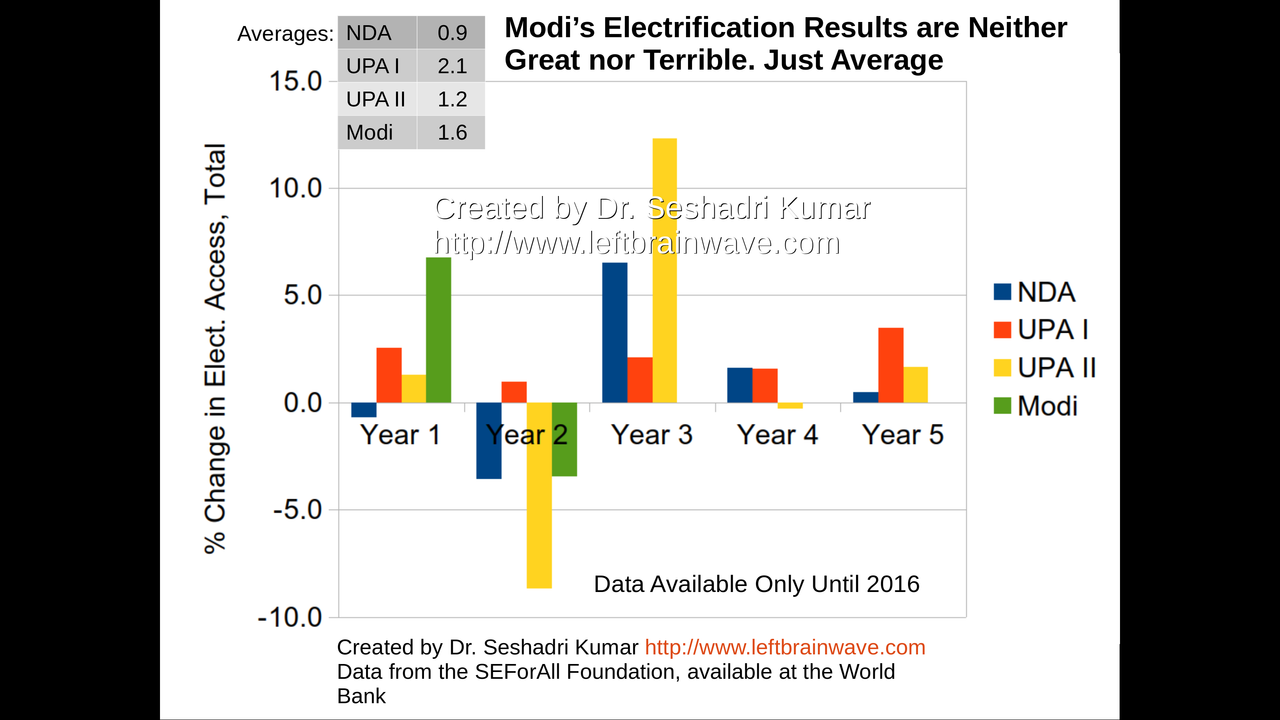
Growth in Overall Electrification
50 / 120
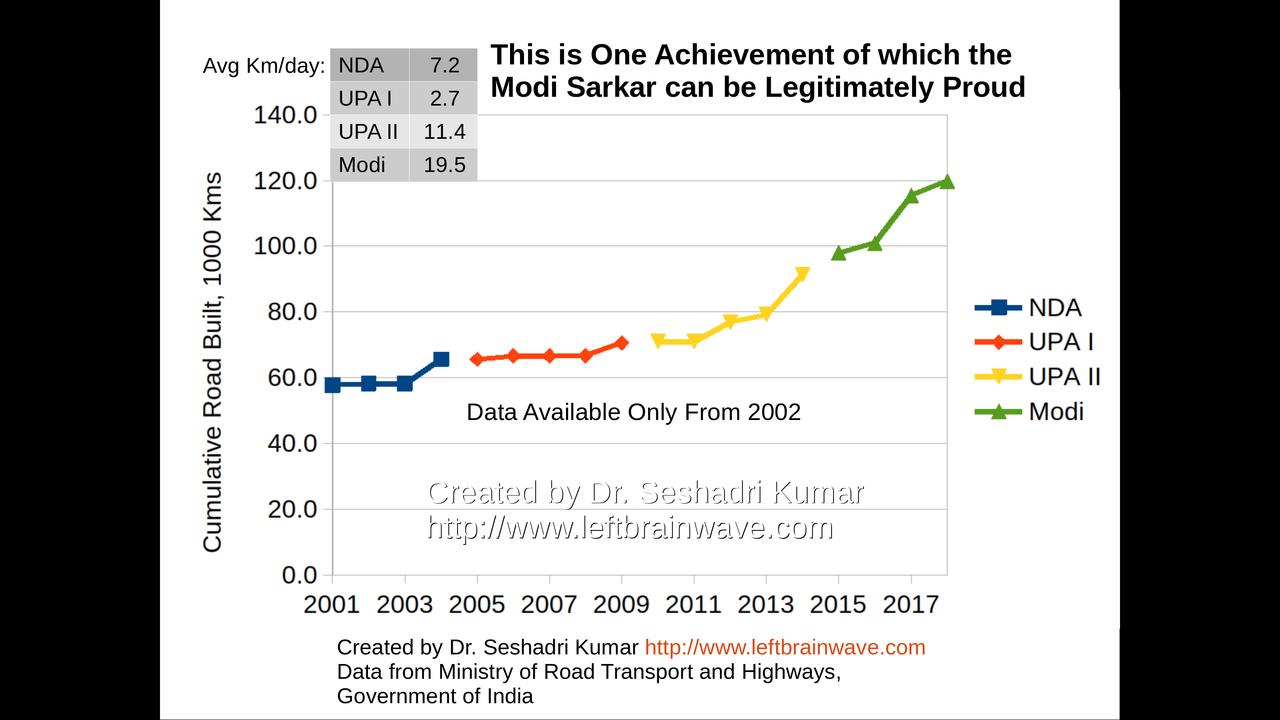
Average Road Km Built Per Day
51 / 120
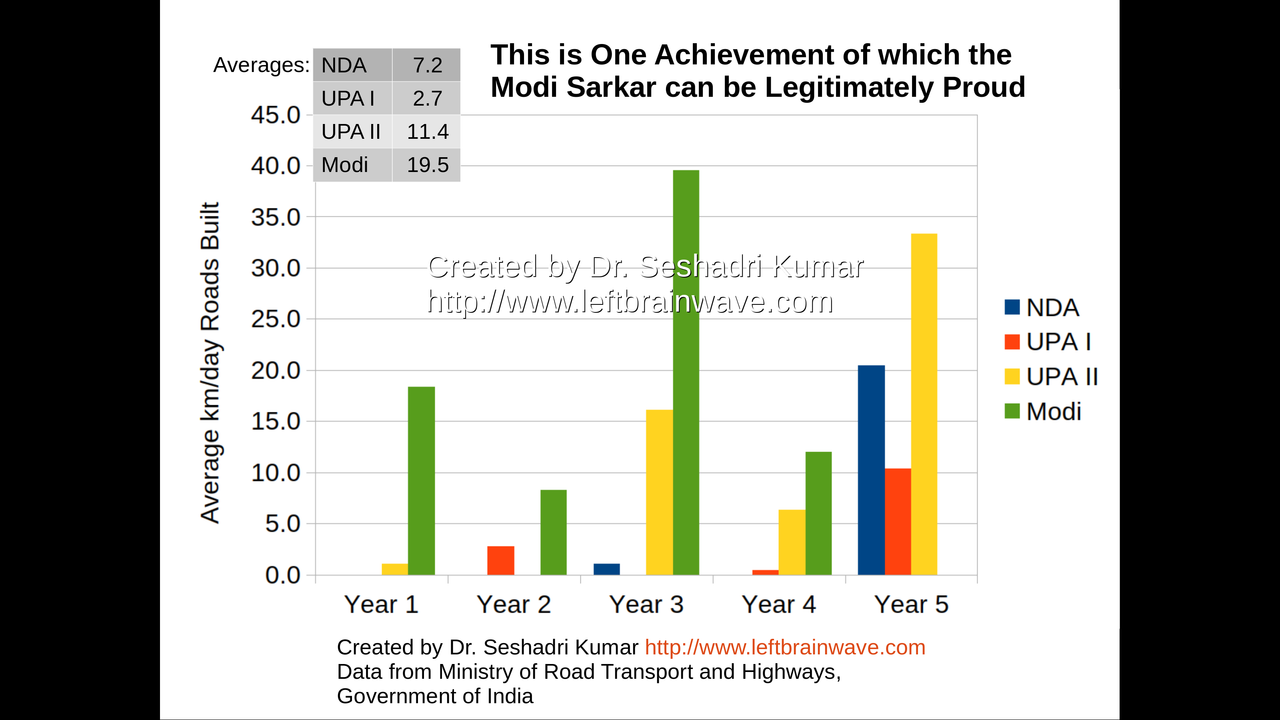
Average Road Km Built Per Day
52 / 120
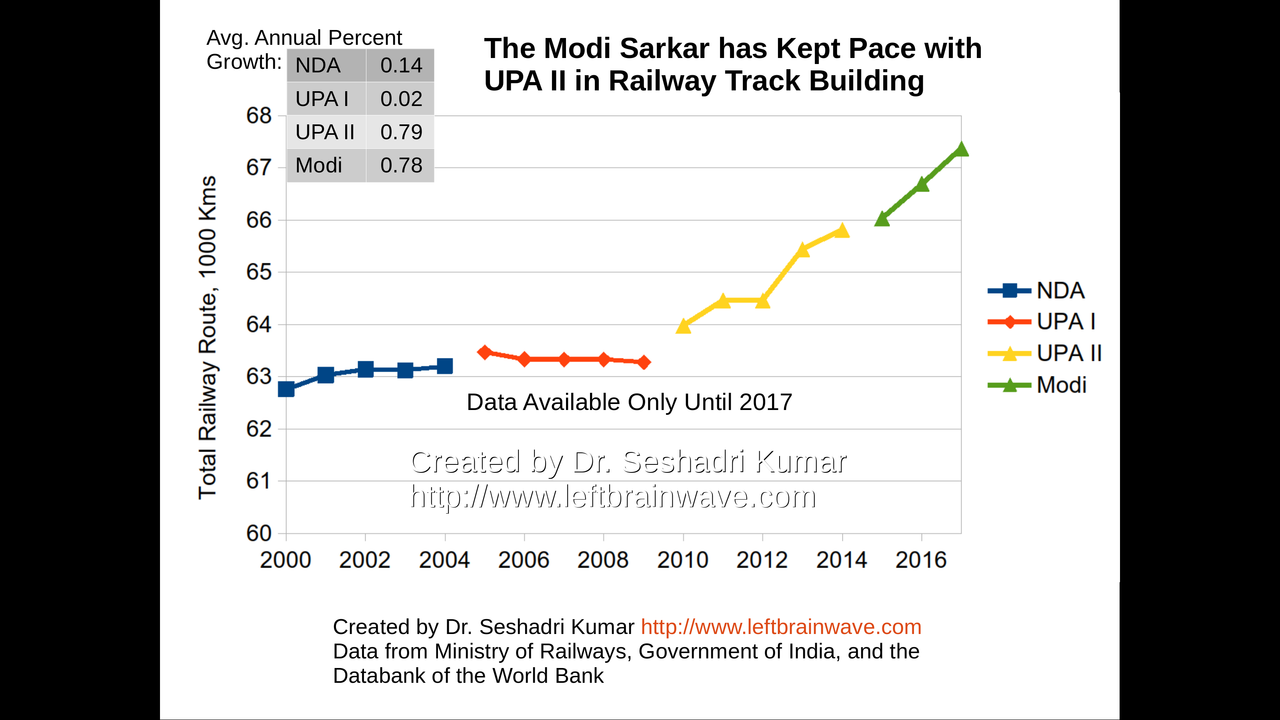
Growth in Railway Track Length
53 / 120
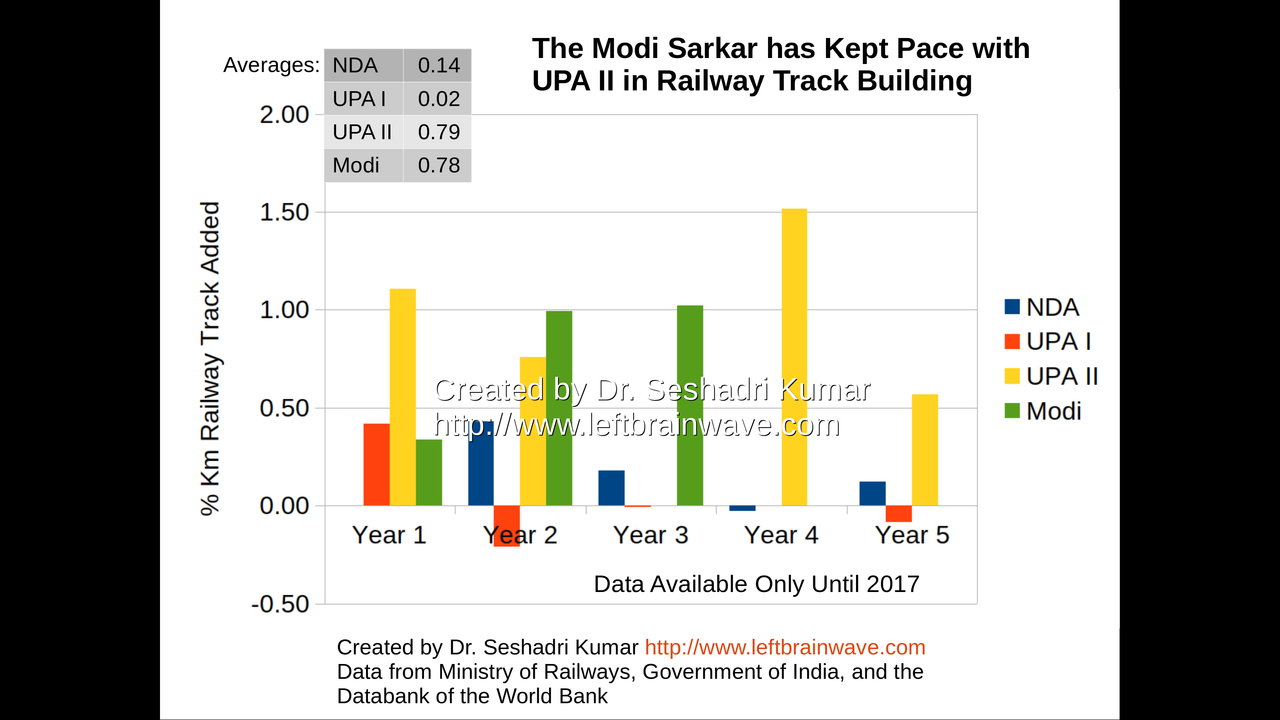
Growth in Railway Track Length
54 / 120
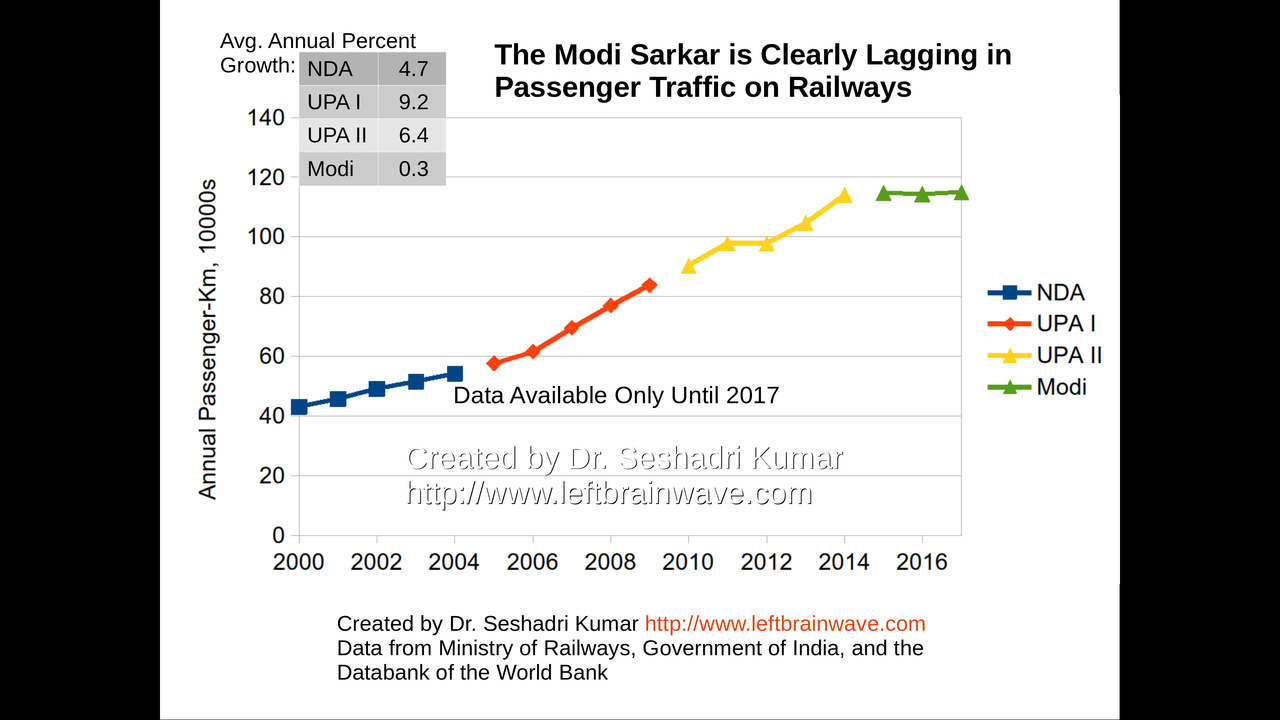
Growth in Passenger Traffic
55 / 120
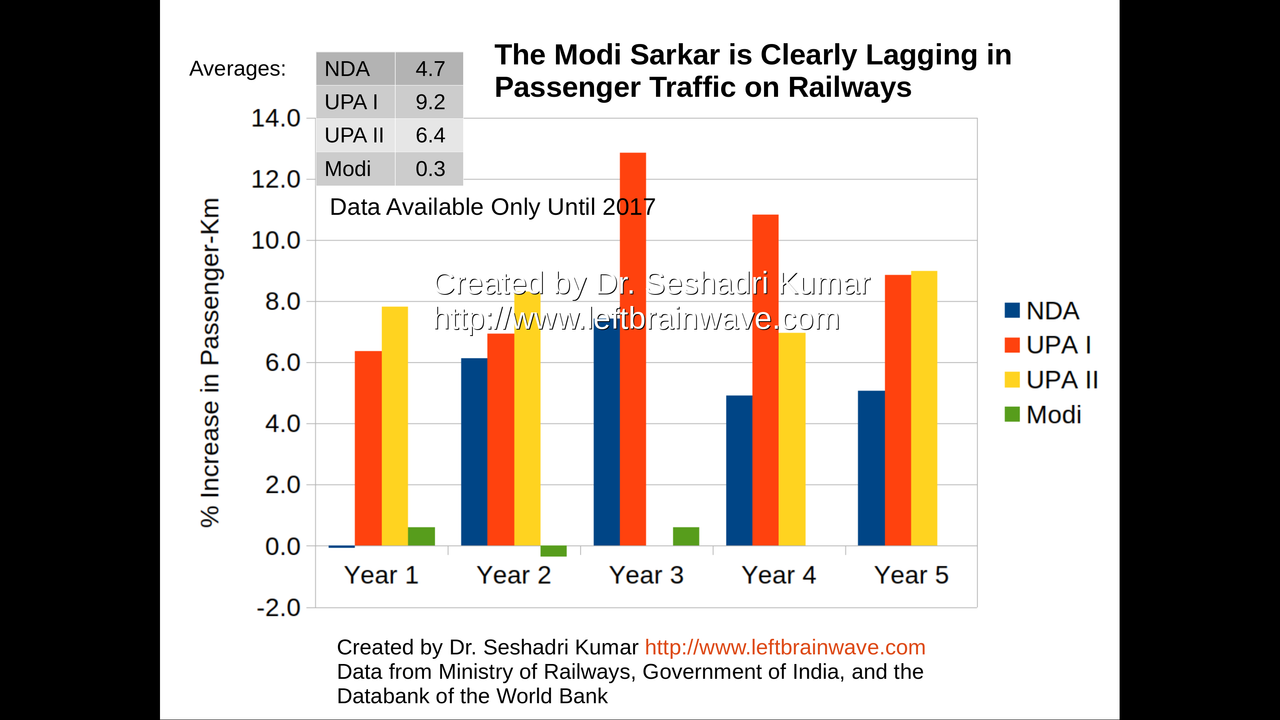
Growth in Passenger Traffic
56 / 120
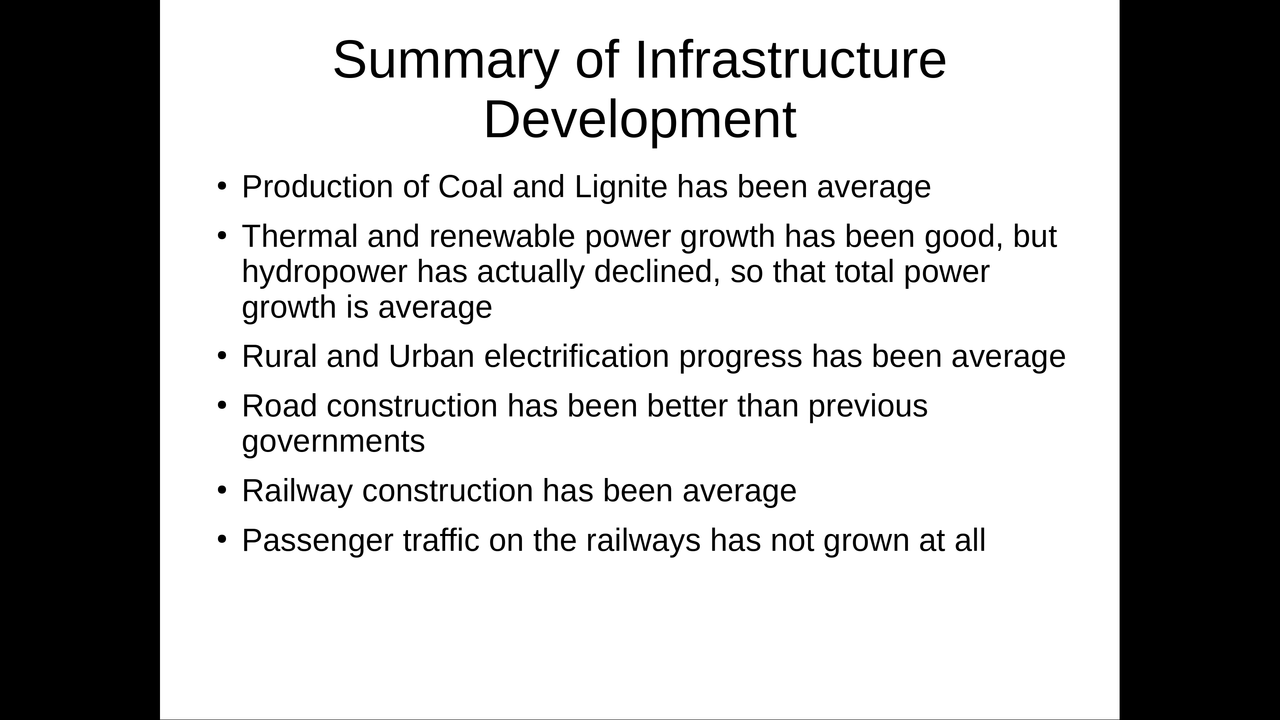
Summary: Infrastructure Development Comparison
57 / 120
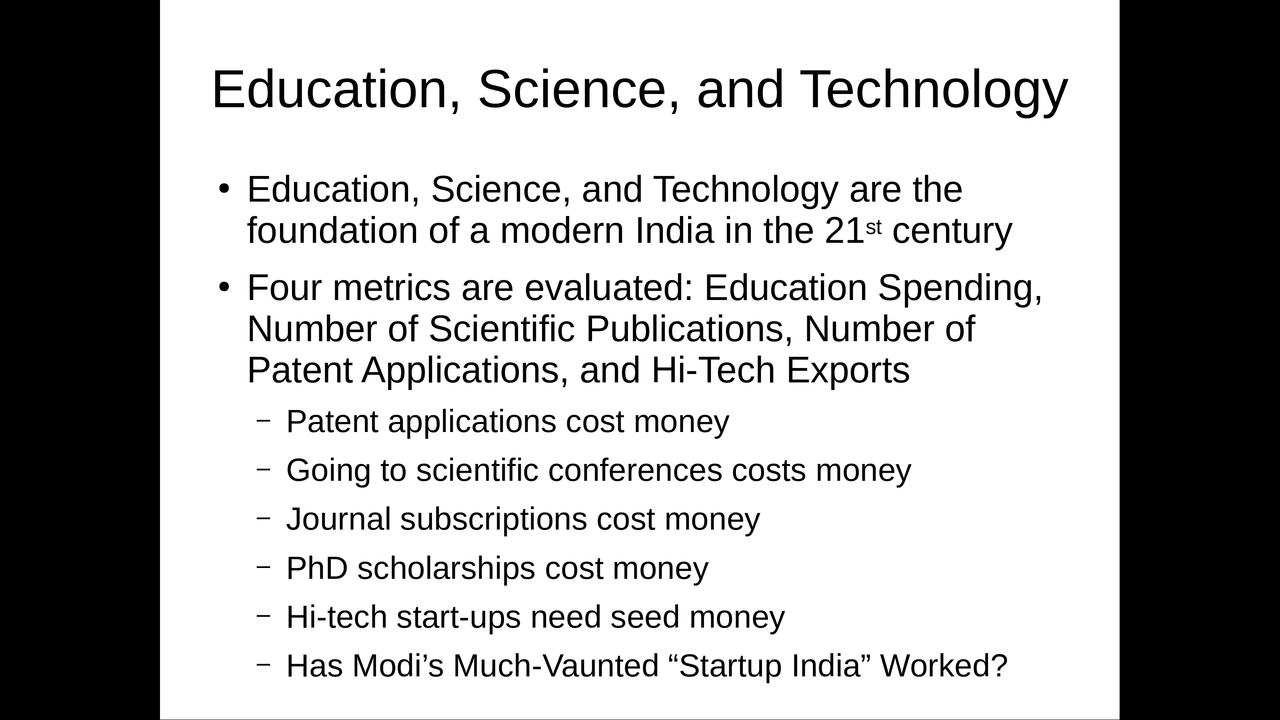
Education, Science, and Technology
58 / 120
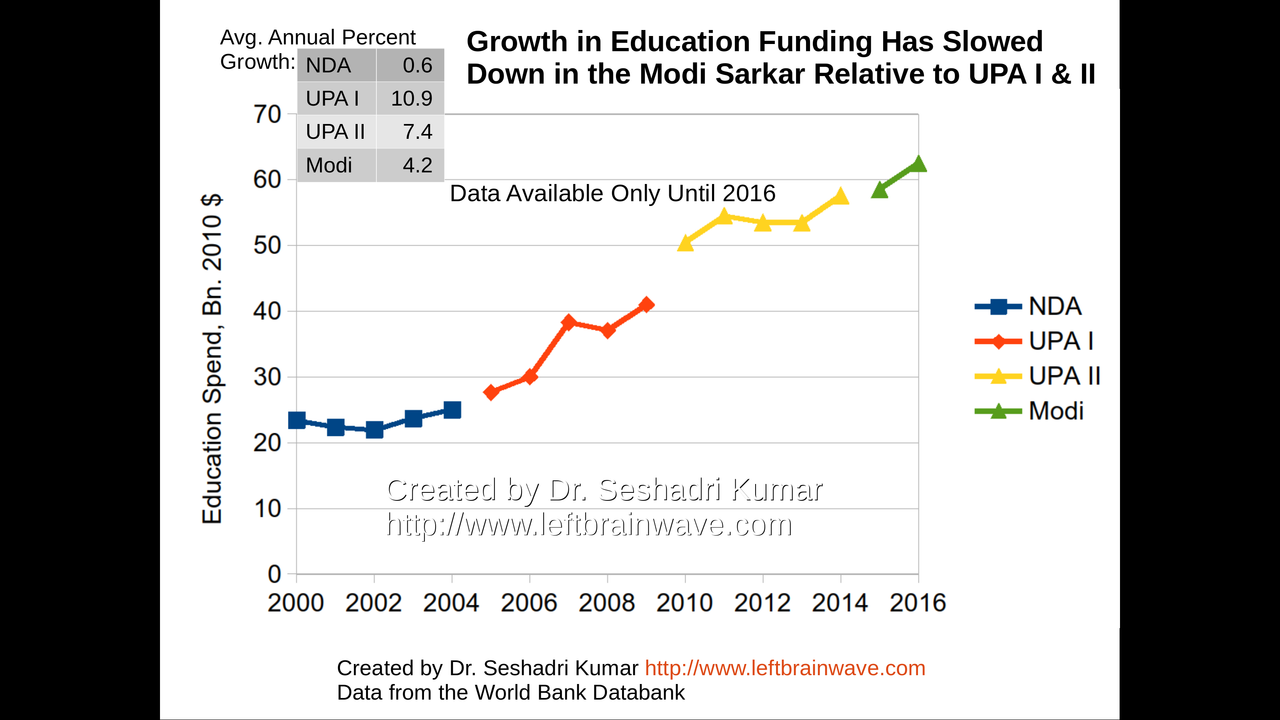
Growth in Education Funding
59 / 120
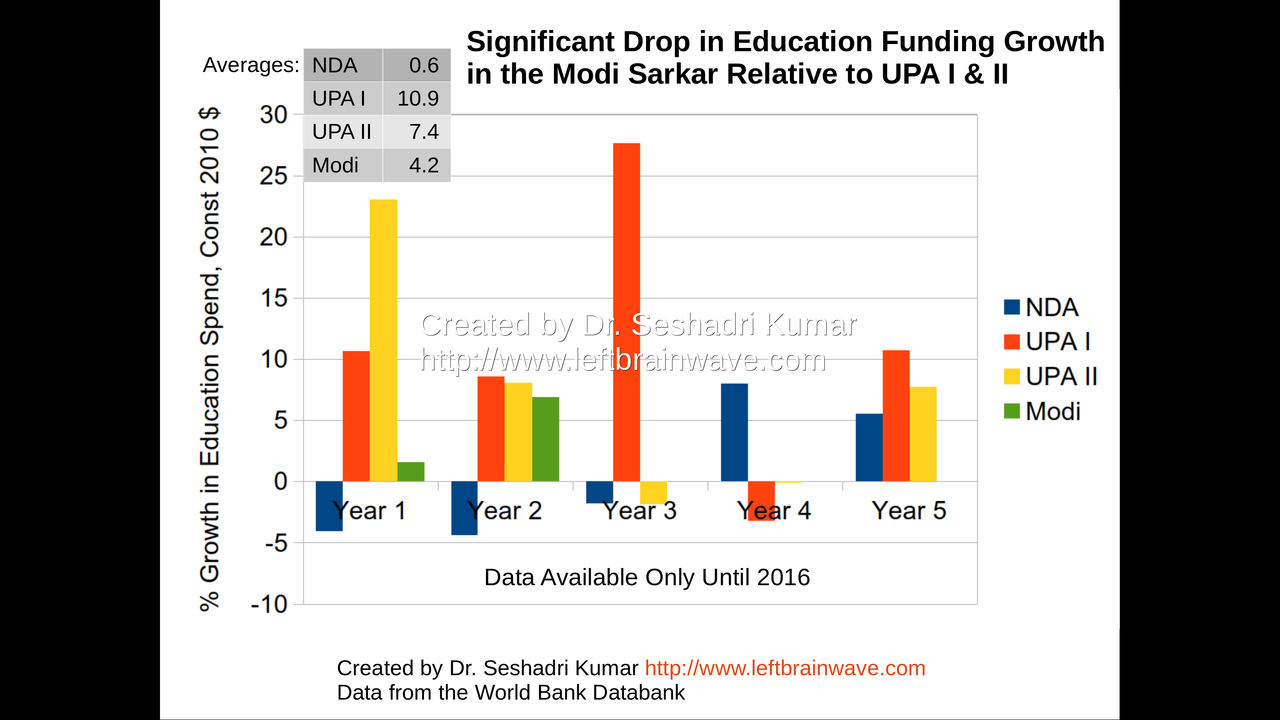
Growth in Education Funding
60 / 120
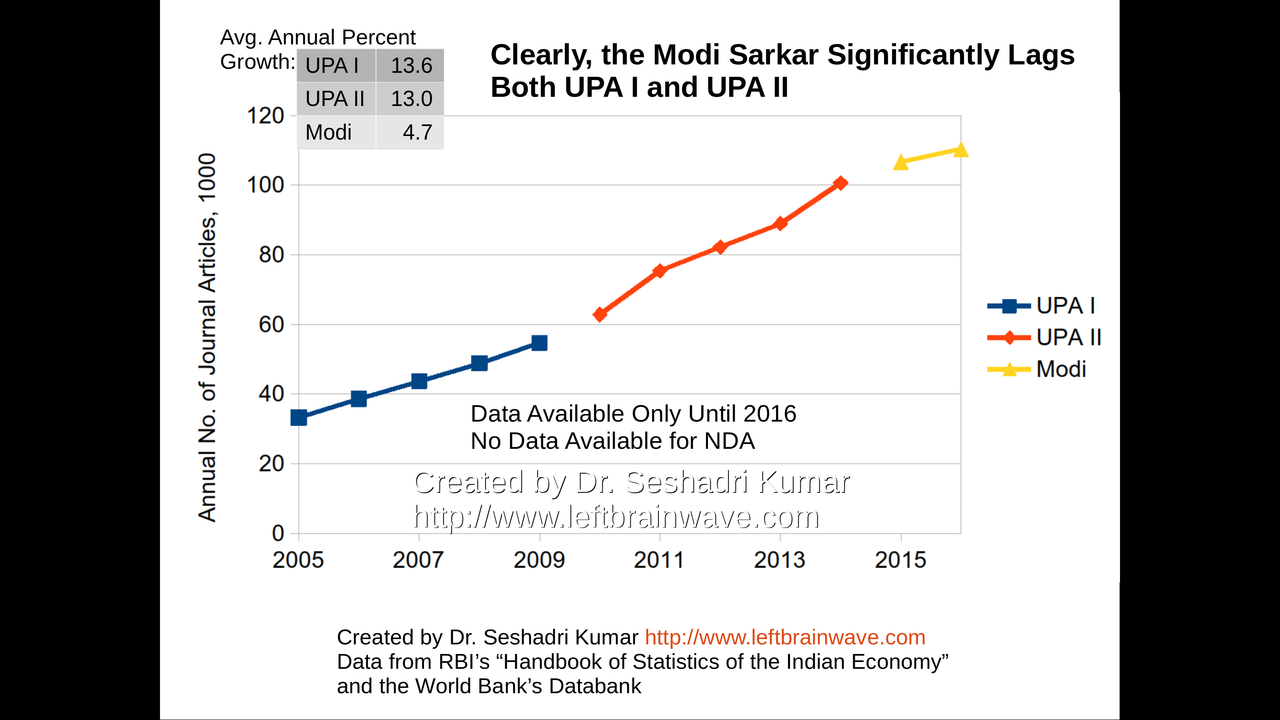
Growth in Number of Scientific and Technical Articles
61 / 120
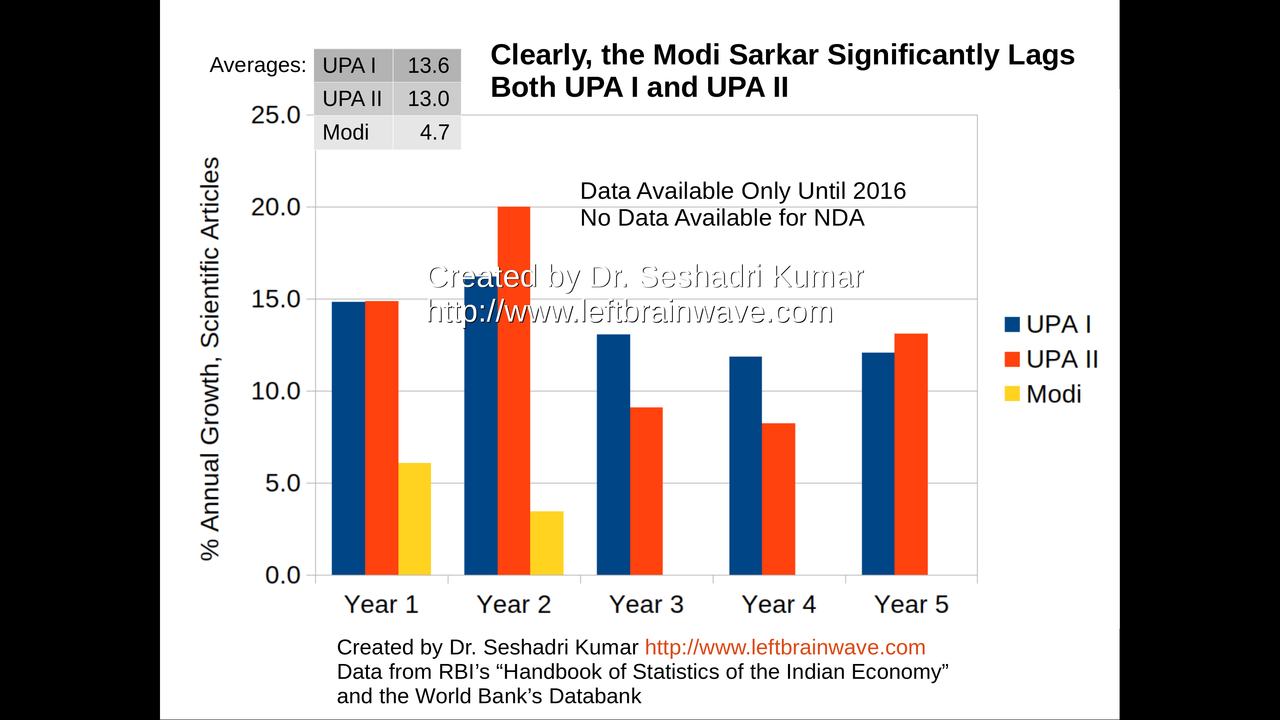
Growth in Number of Scientific and Technical Articles
62 / 120
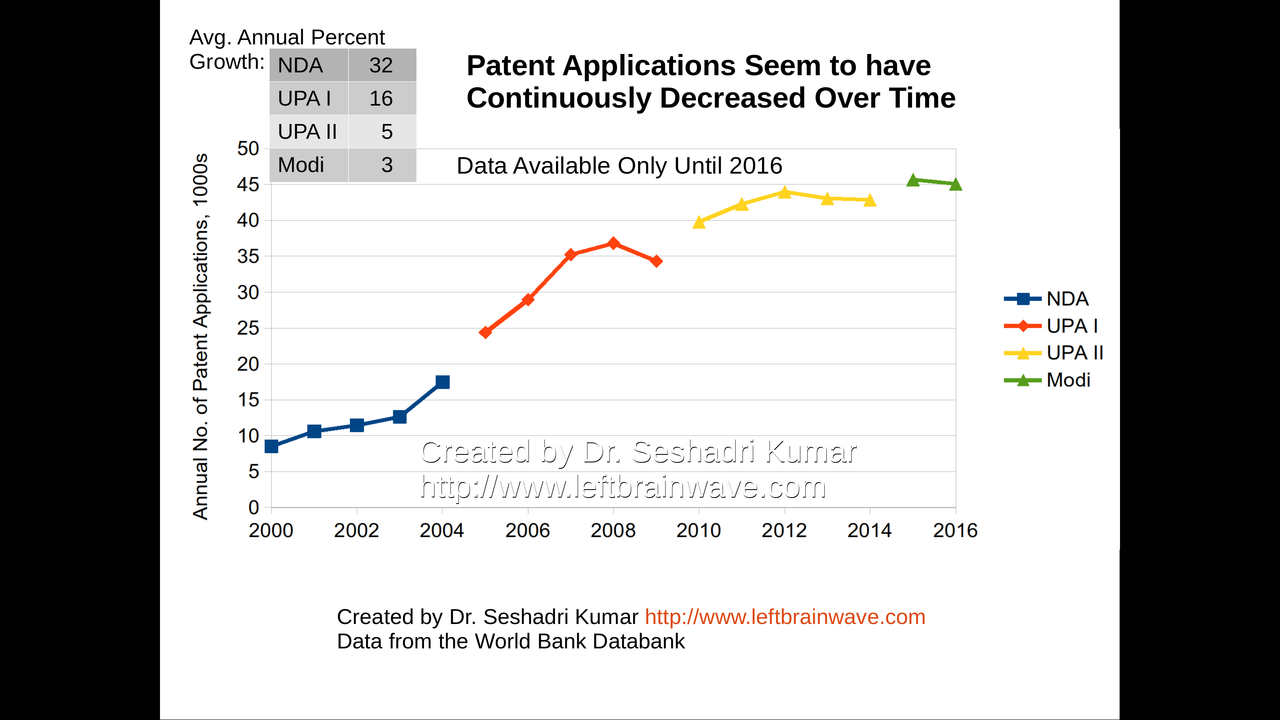
Growth in Number of Patent Applications
63 / 120
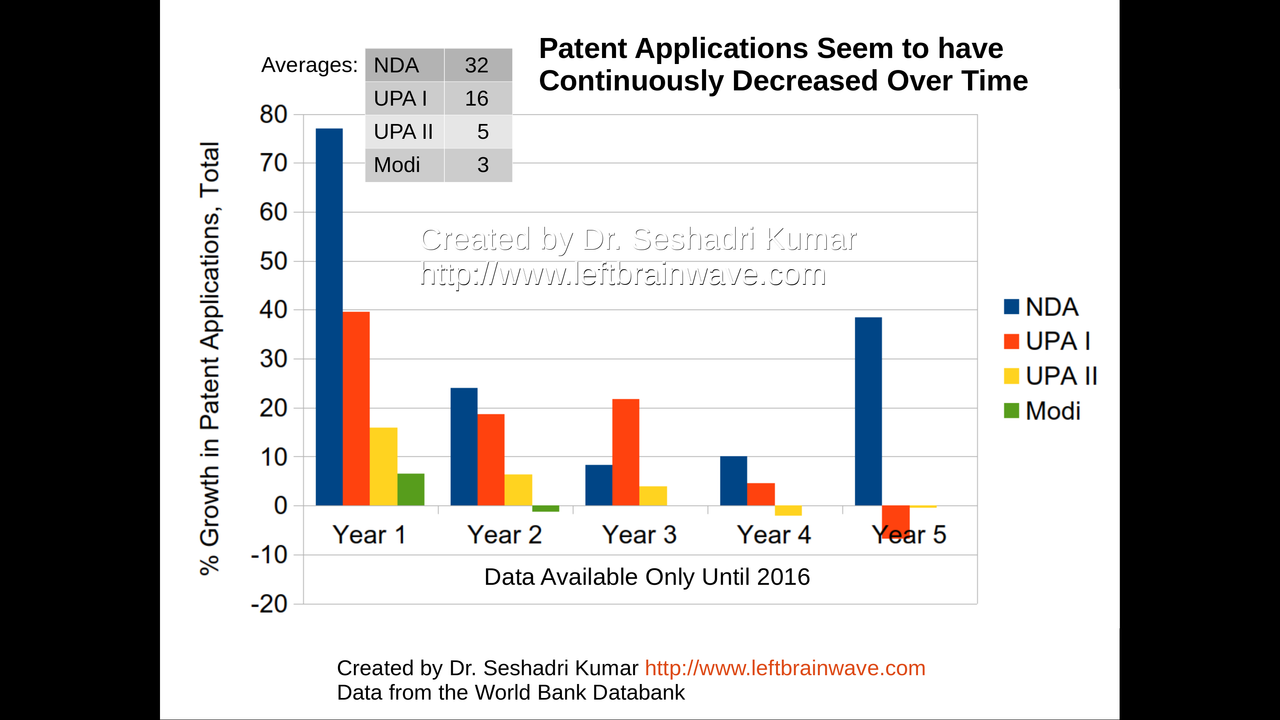
Growth in Number of Patent Applications
64 / 120
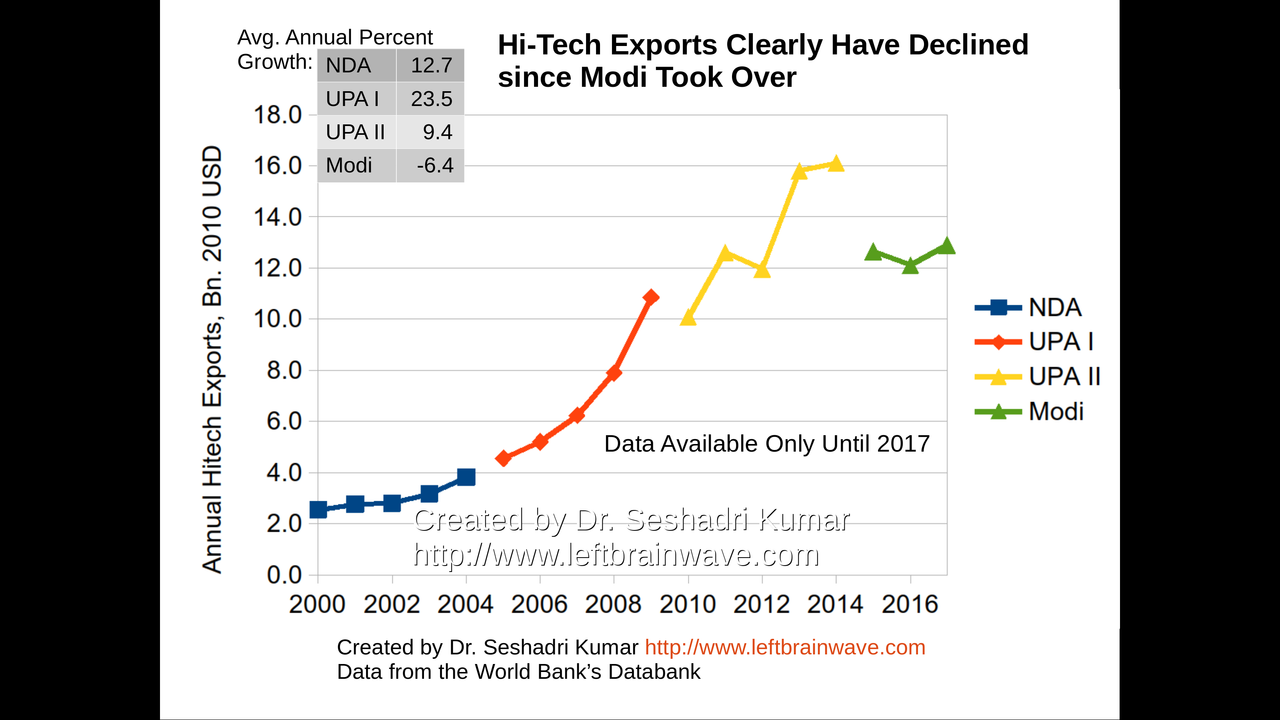
Growth in Hi-Tech Exports
65 / 120
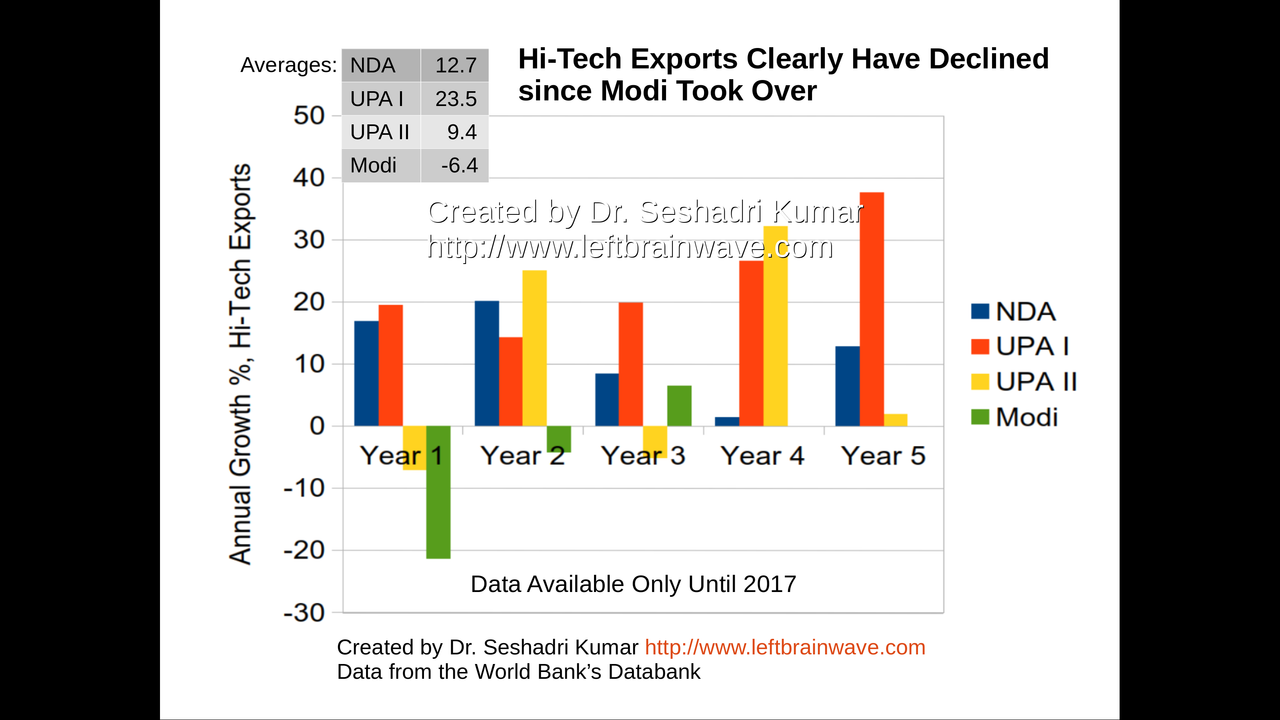
Growth in Hi-Tech Exports
66 / 120
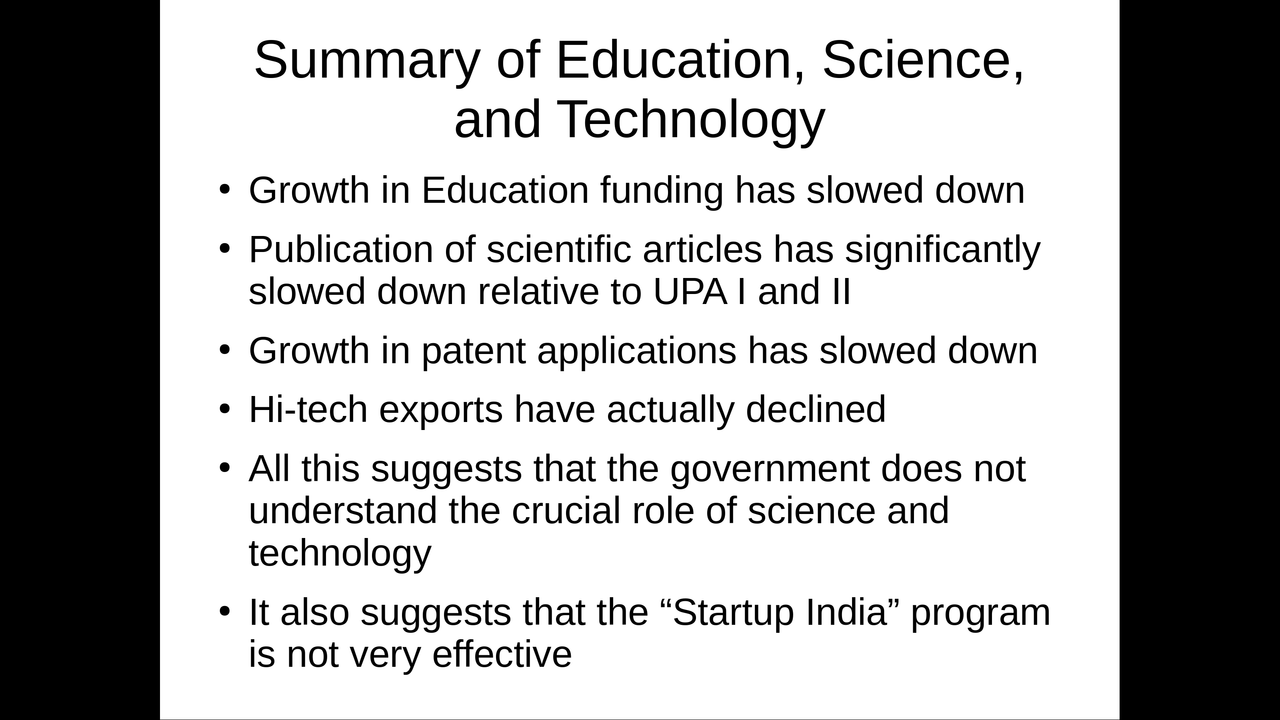
Summary: Education, Science, and Technology
67 / 120
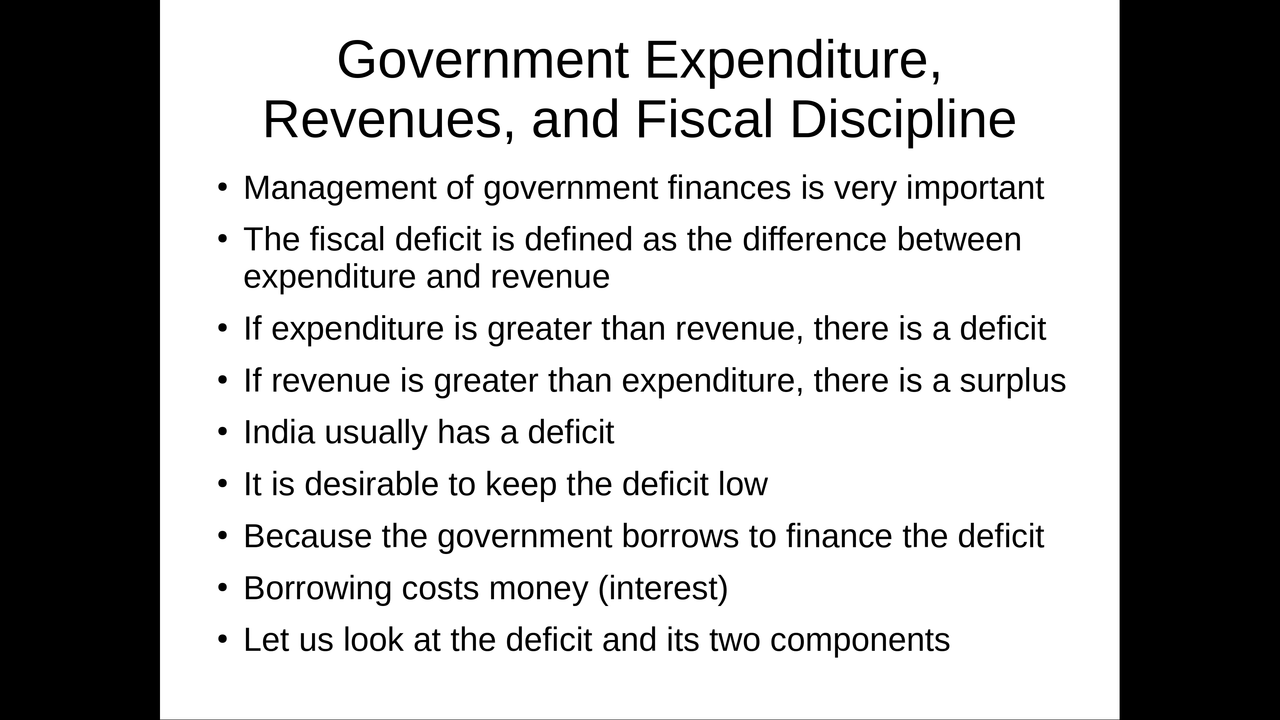
Government Expenditure, Revenues, and Fiscal Discipline
68 / 120
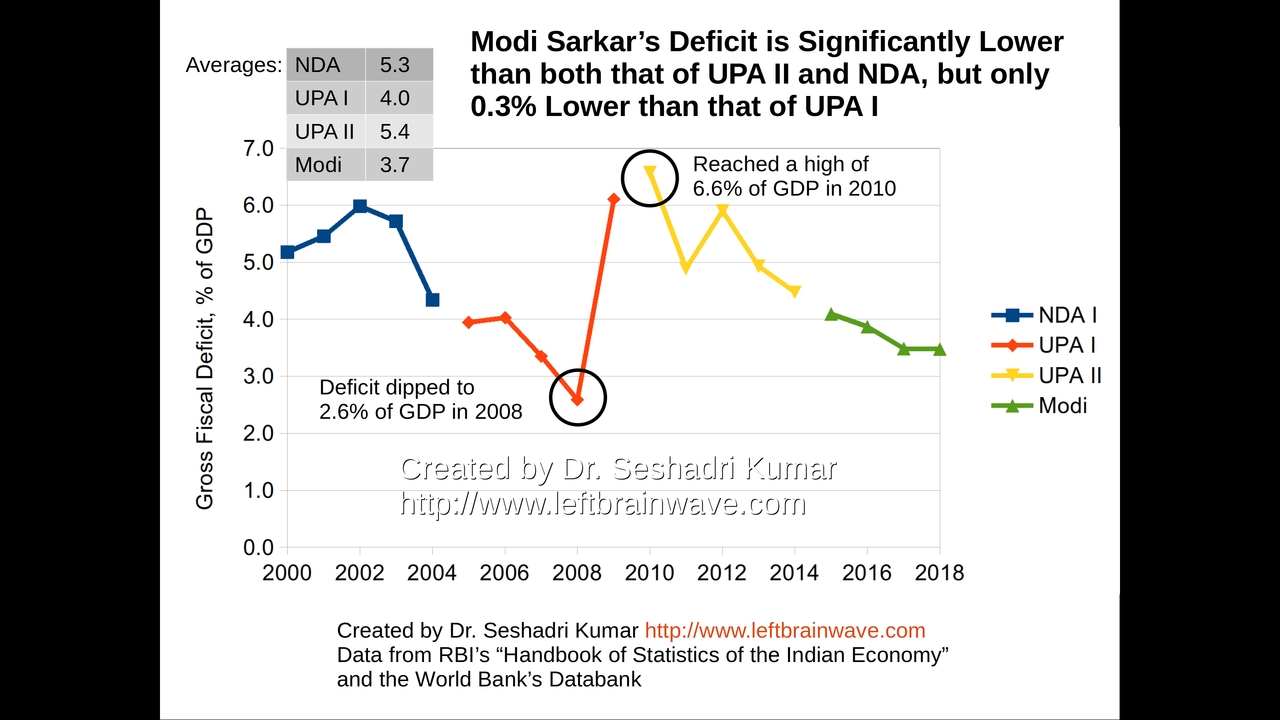
Gross Fiscal Deficit
69 / 120
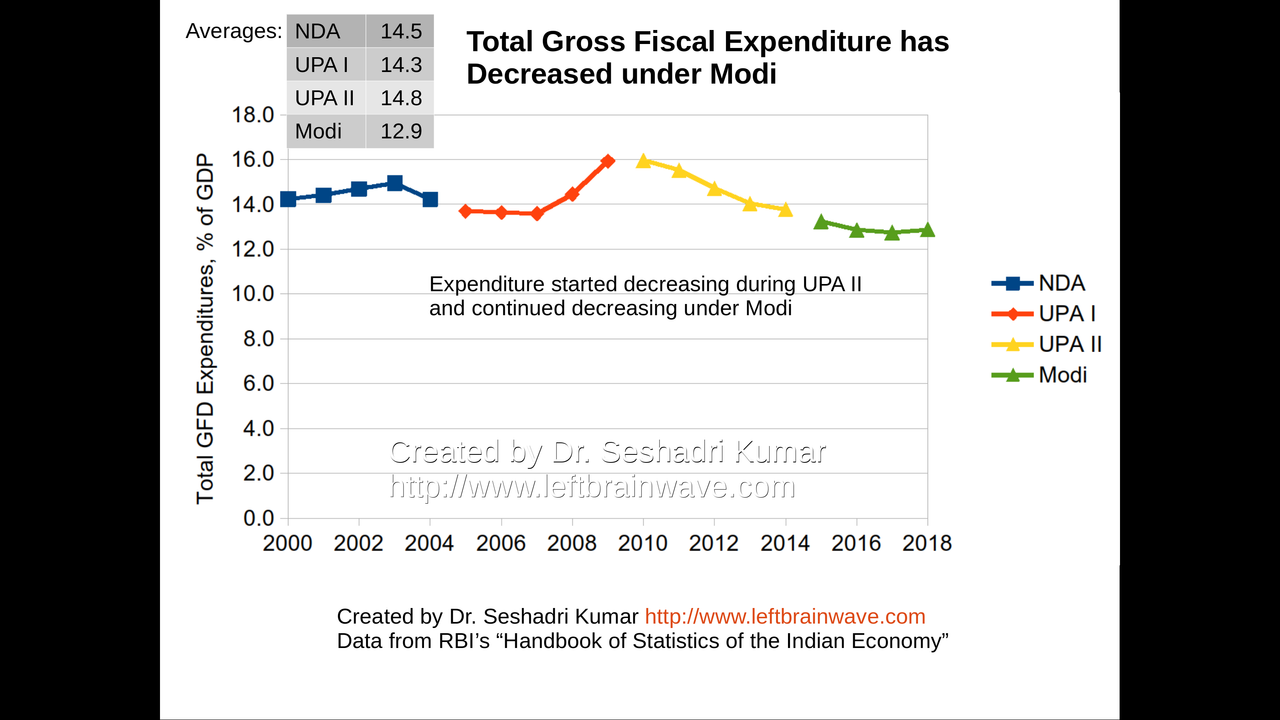
Total Expenditure
70 / 120
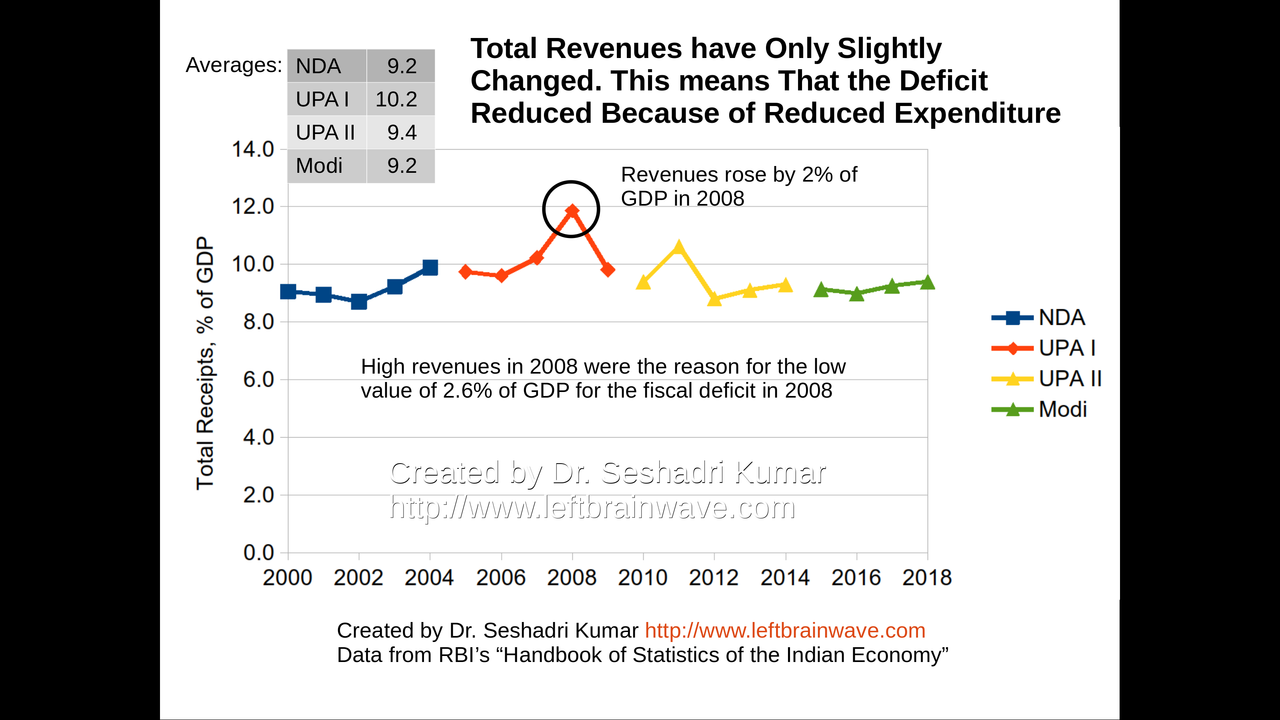
Total Revenues
71 / 120
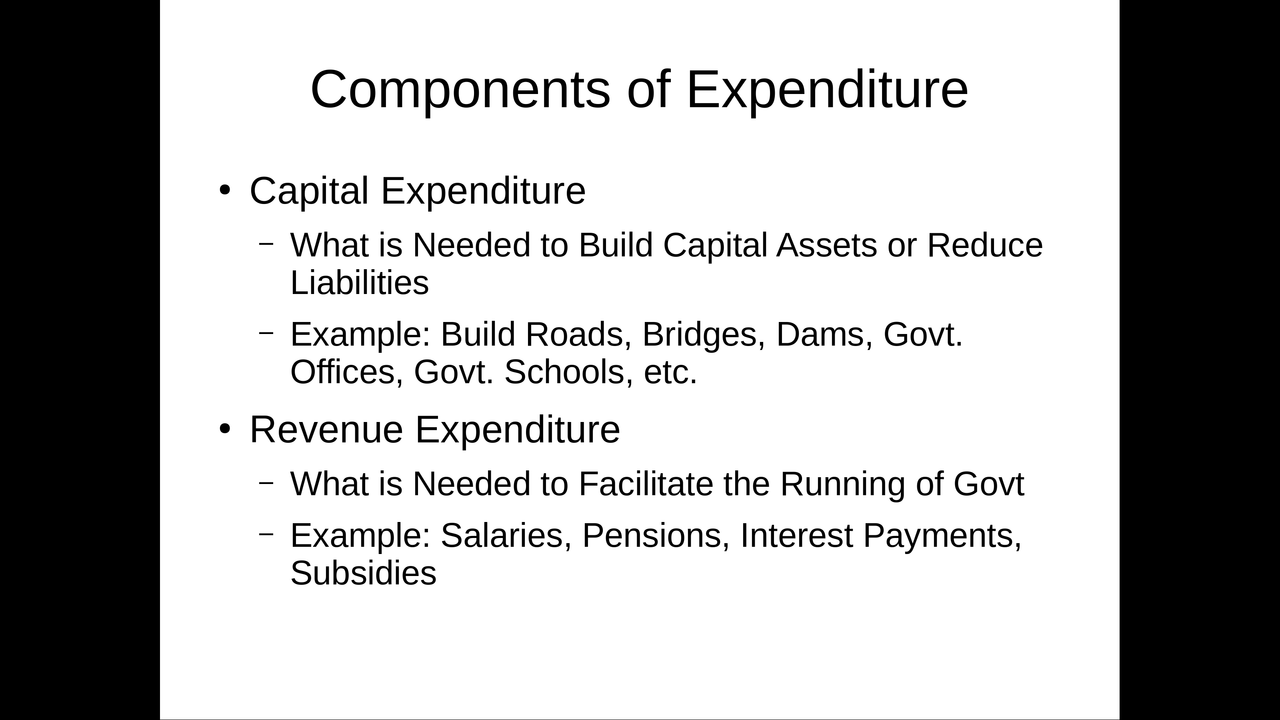
Components of Expenditure
72 / 120
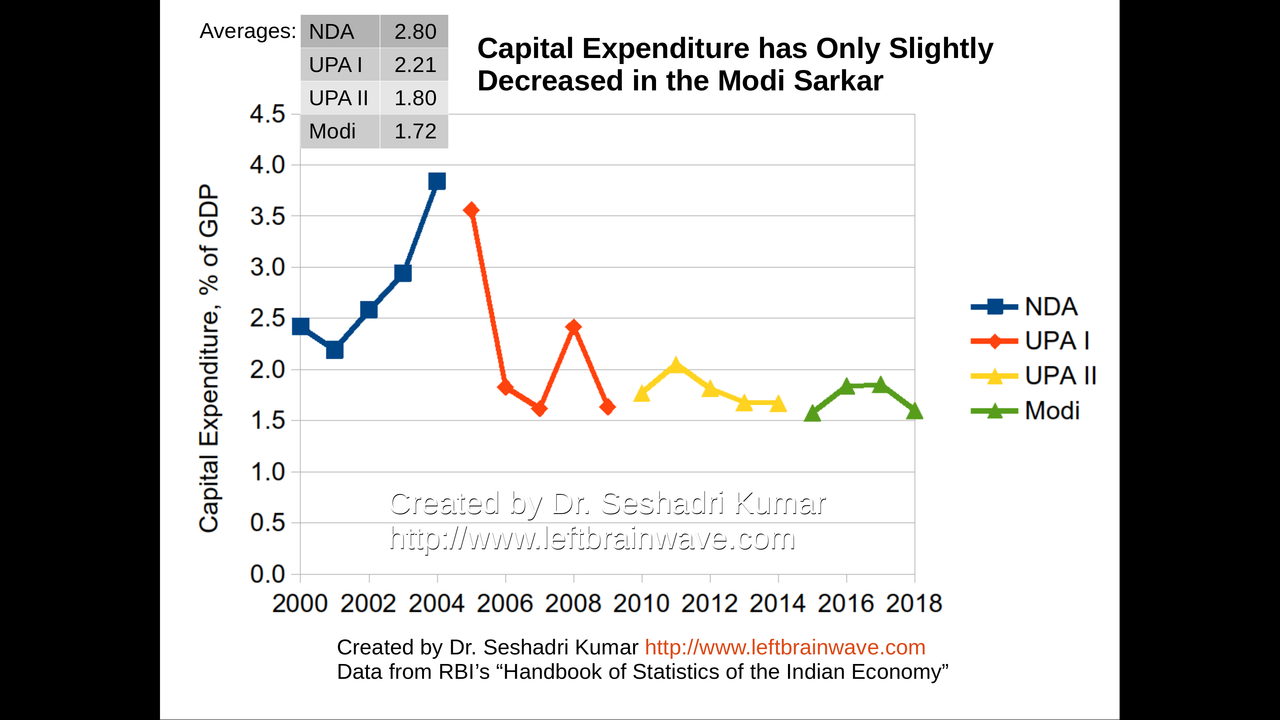
Capital Expenditure
73 / 120
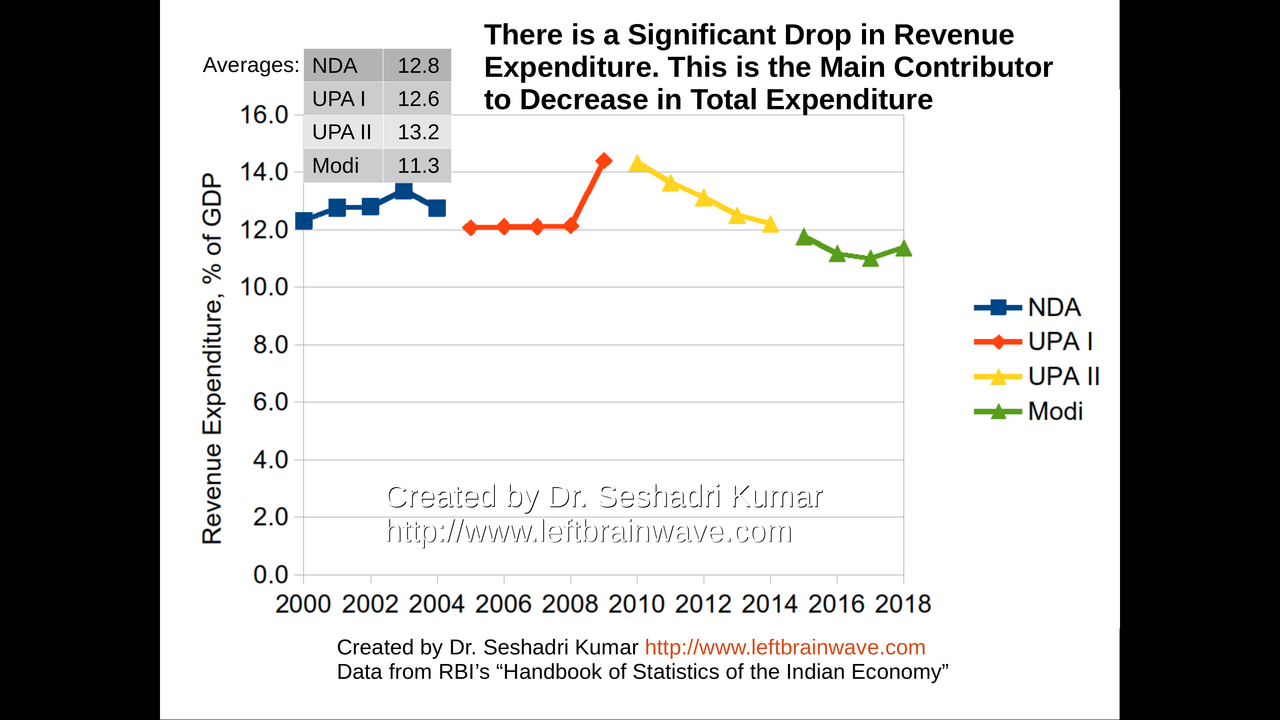
Revenue Expenditure
74 / 120
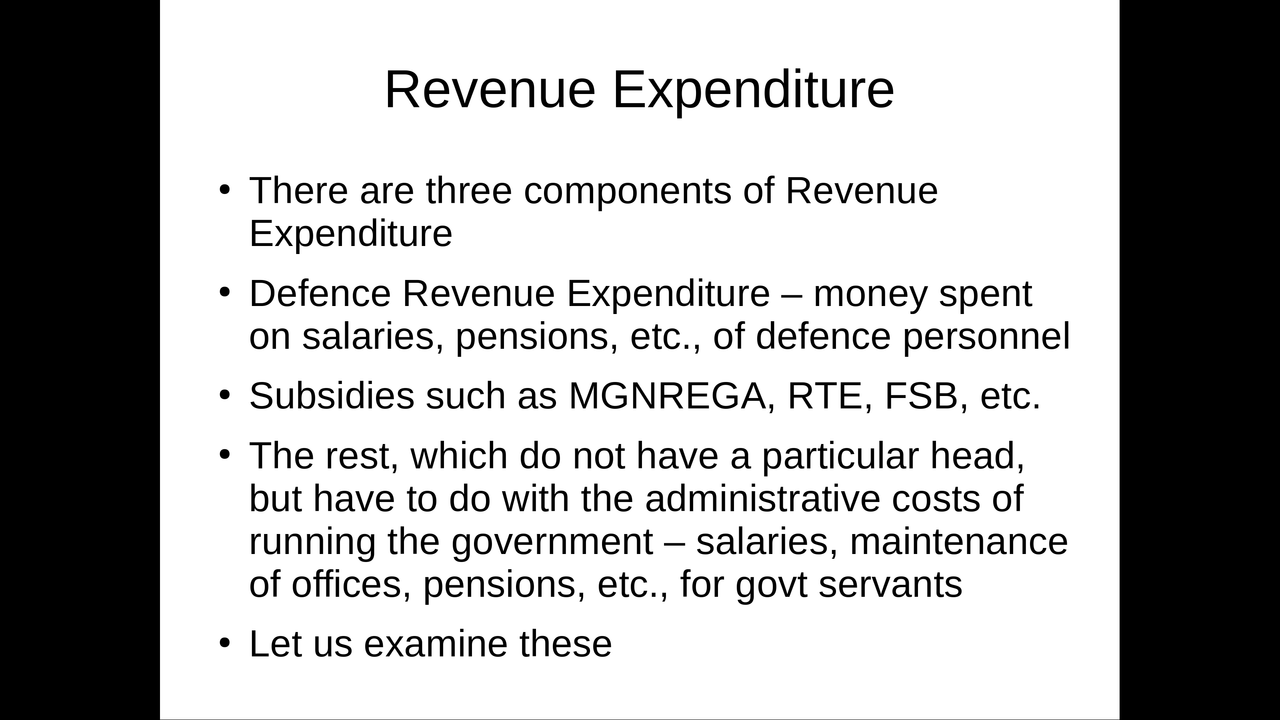
Components of Revenue Expenditure
75 / 120
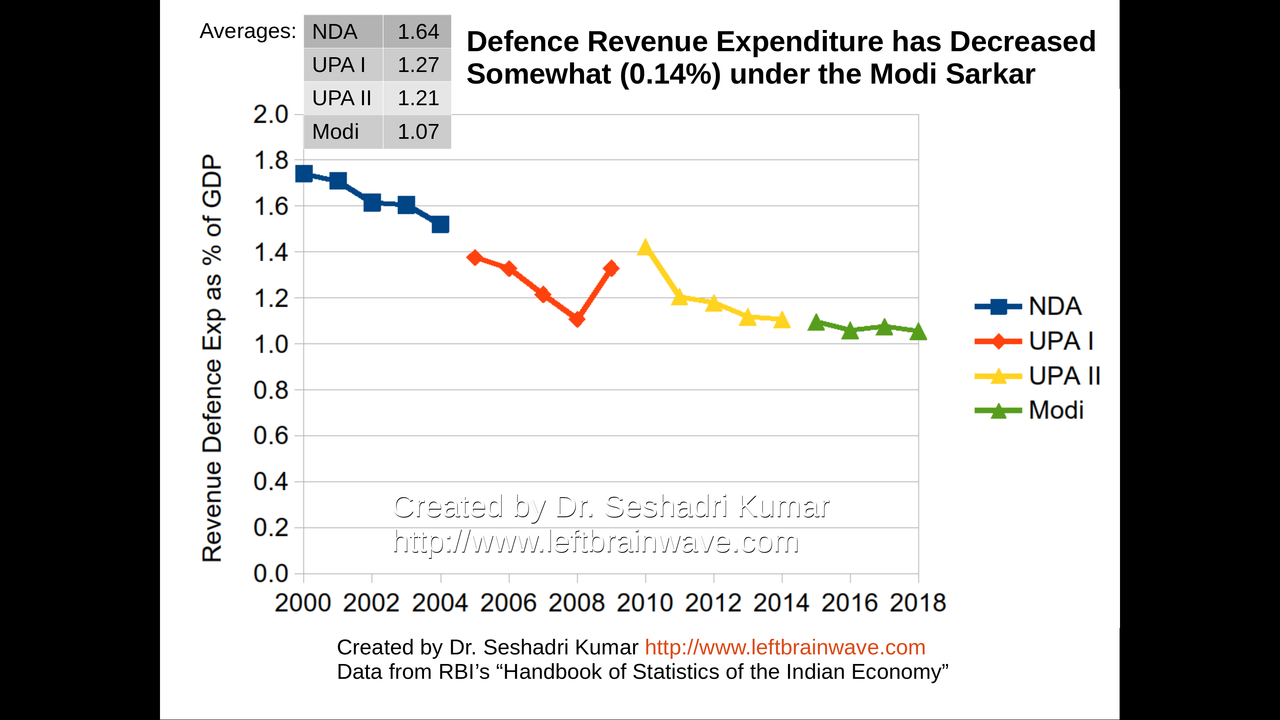
Defence Revenue Expenditure
76 / 120
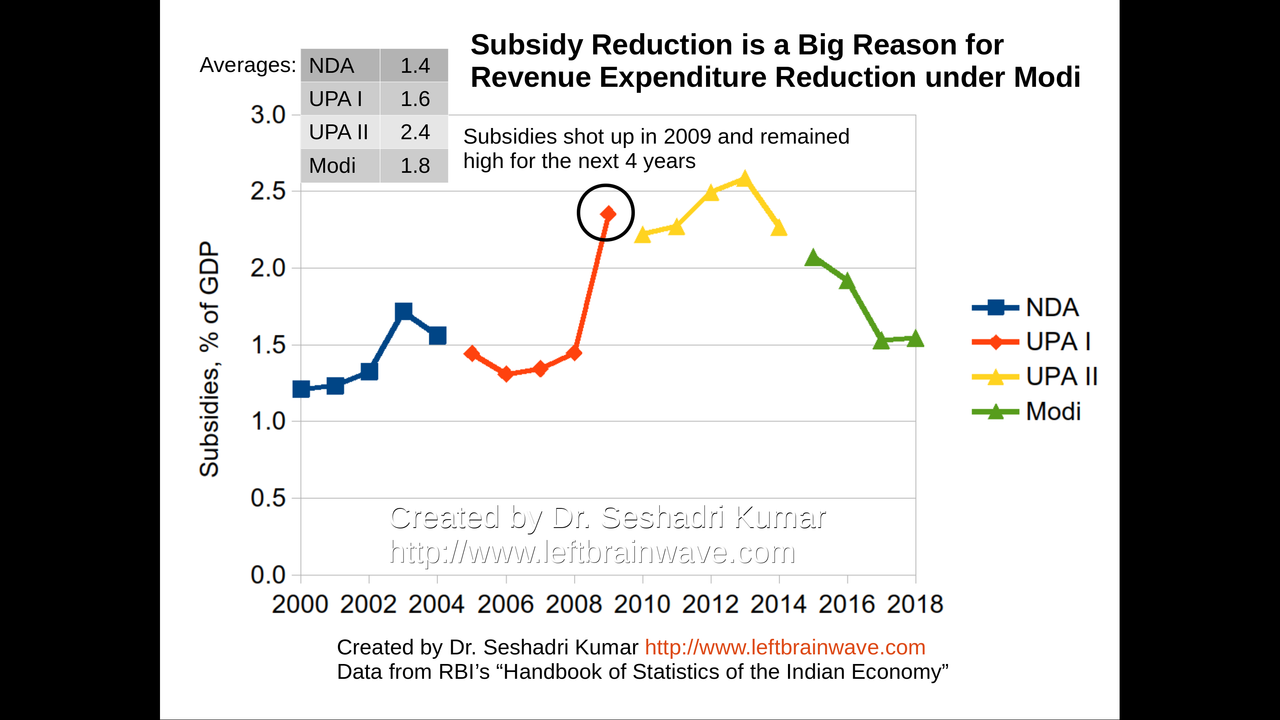
Expenditure on Subsidies
77 / 120
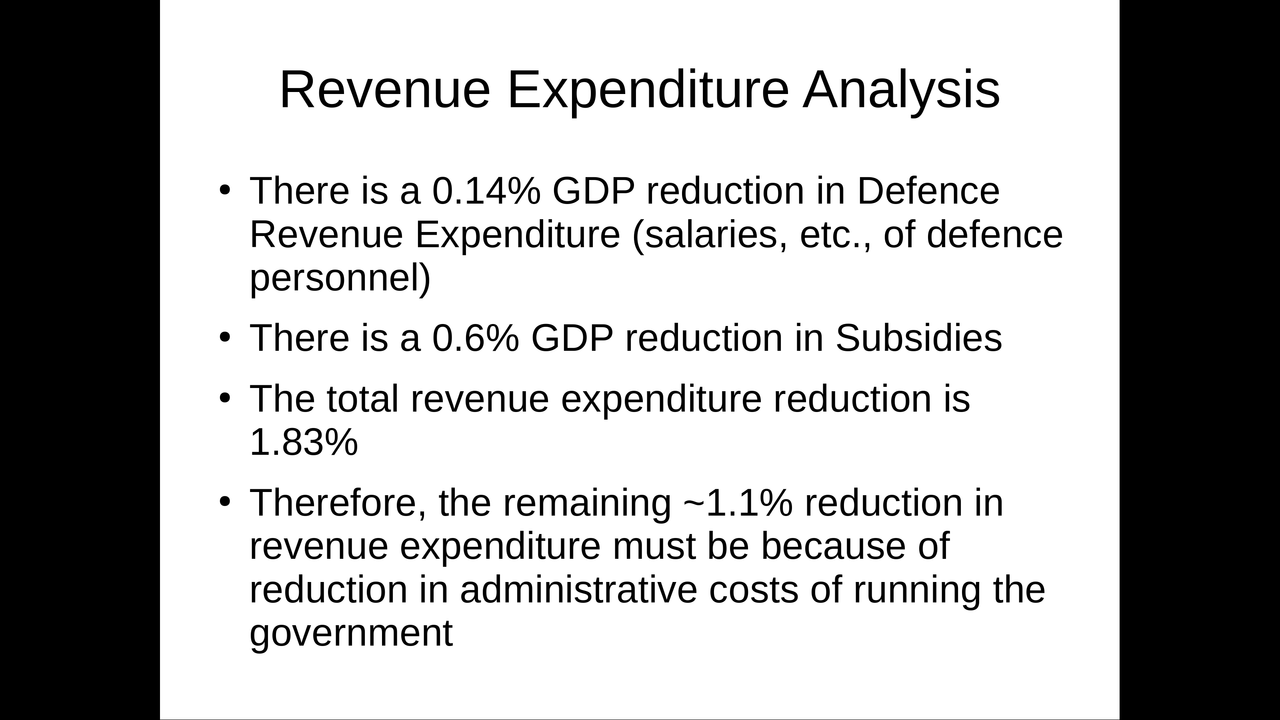
Revenue Expenditure Analysis
78 / 120
Capital Expenditure
79 / 120
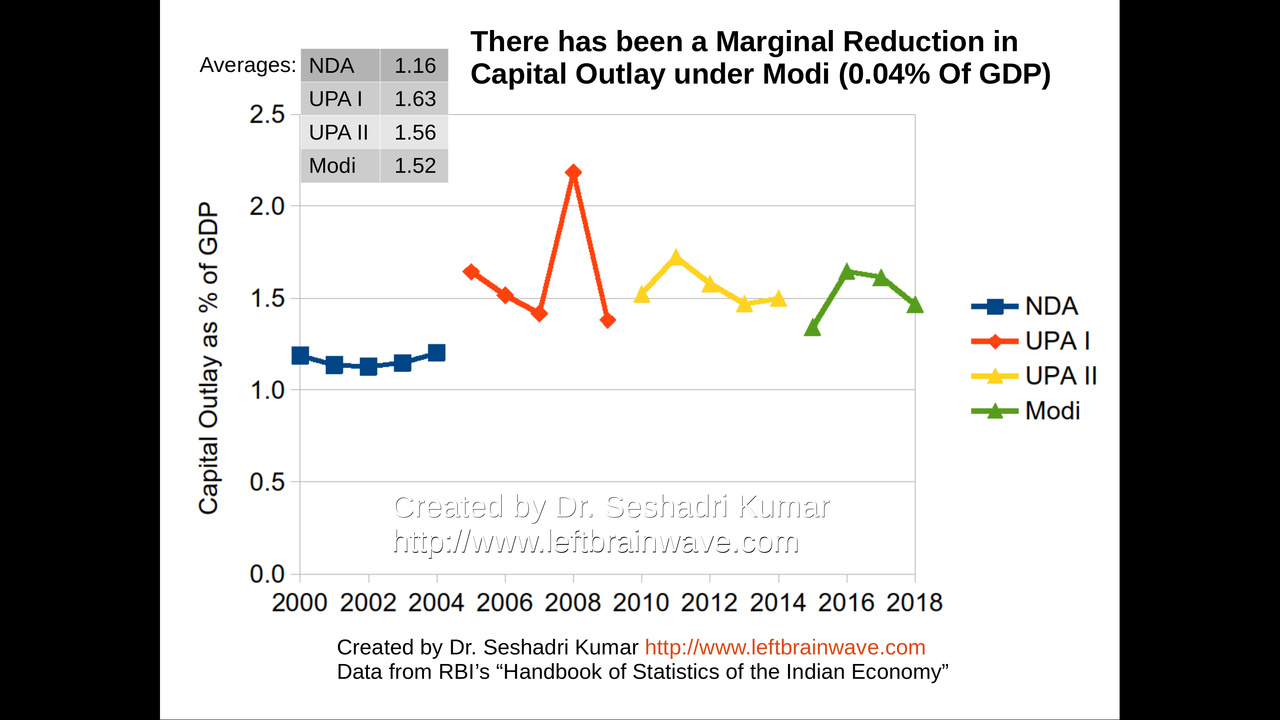
Capital Outlay
80 / 120
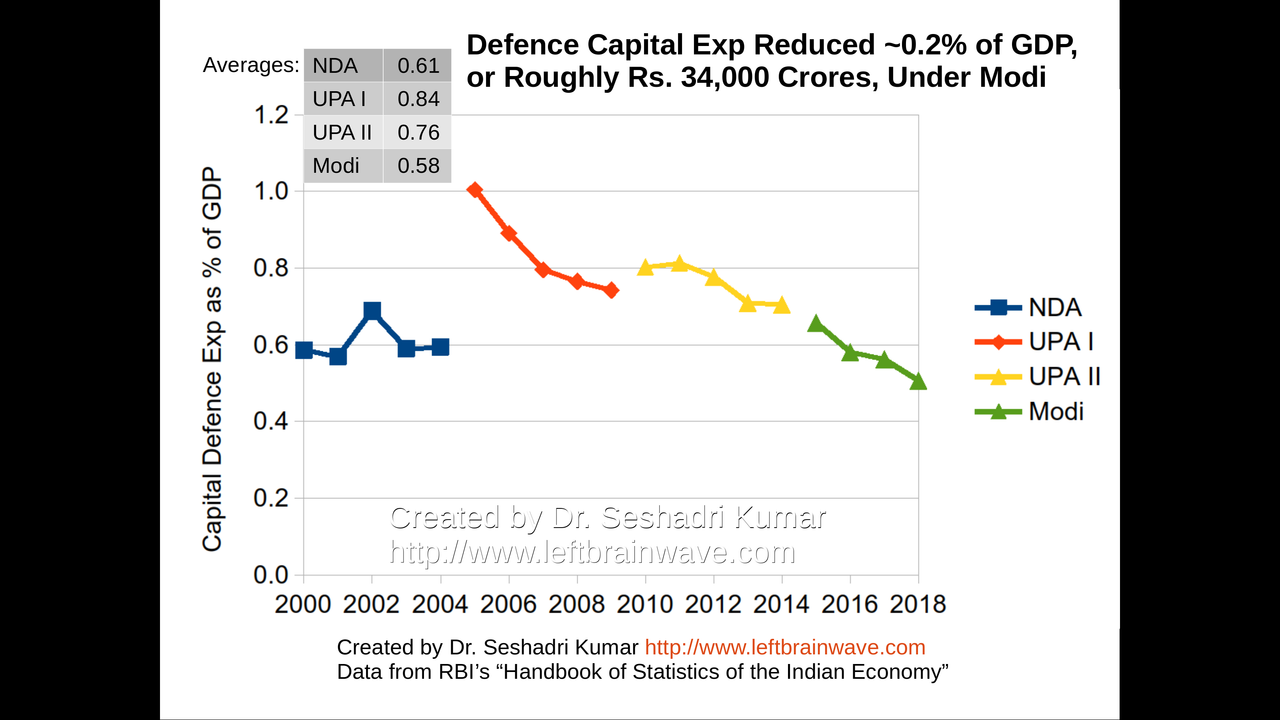
Defence Capital Expenditure
81 / 120
Components of Revenue
82 / 120
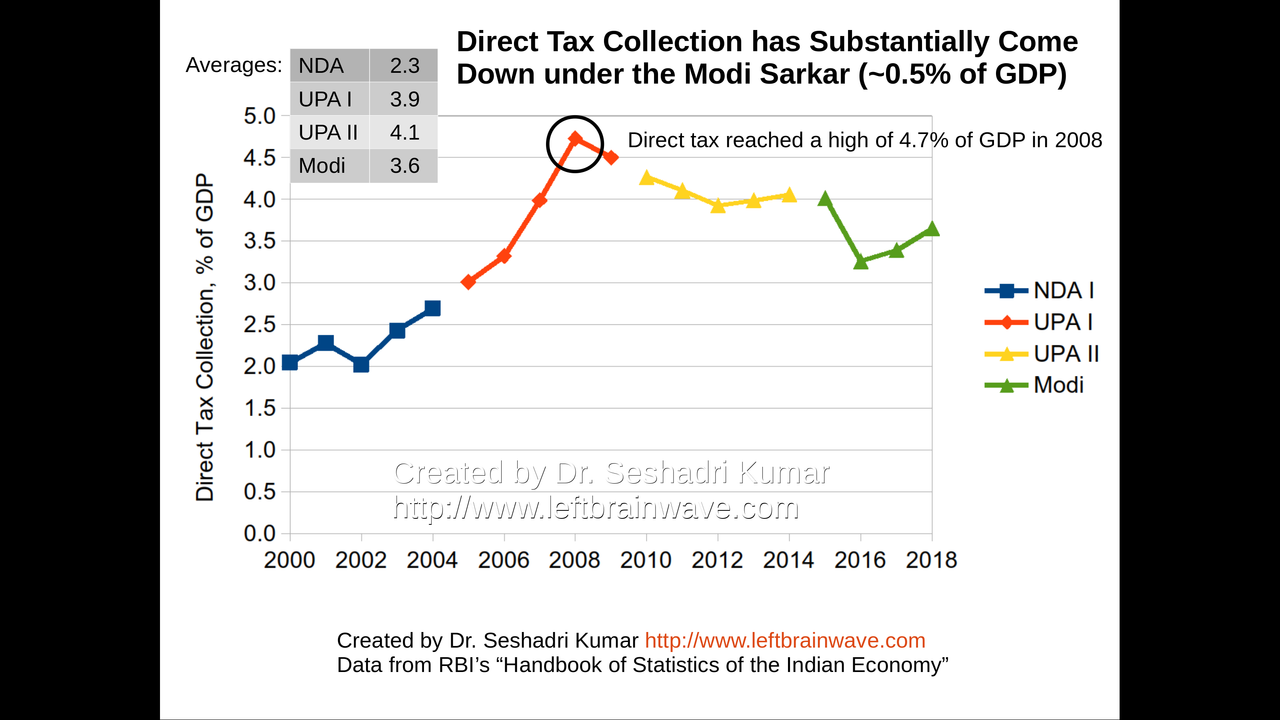
Direct Tax Collection
83 / 120

Personal Income Tax Collection
84 / 120
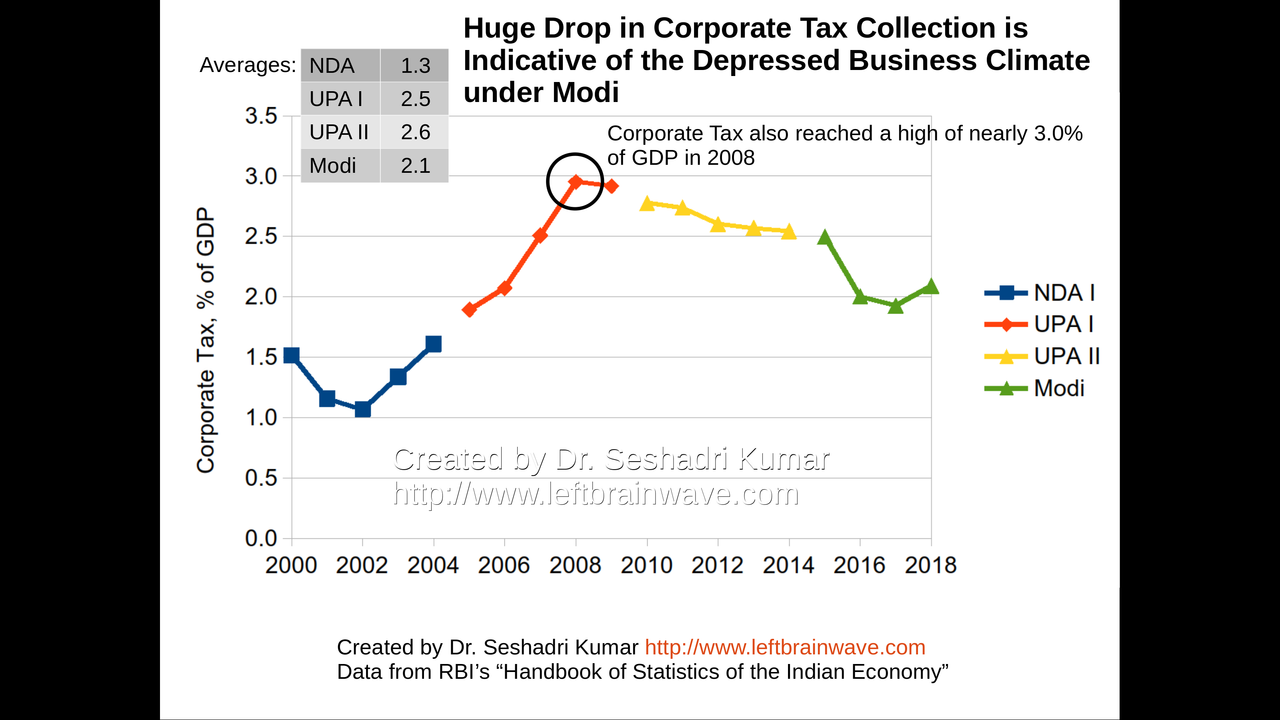
Corporate Tax Collection
85 / 120
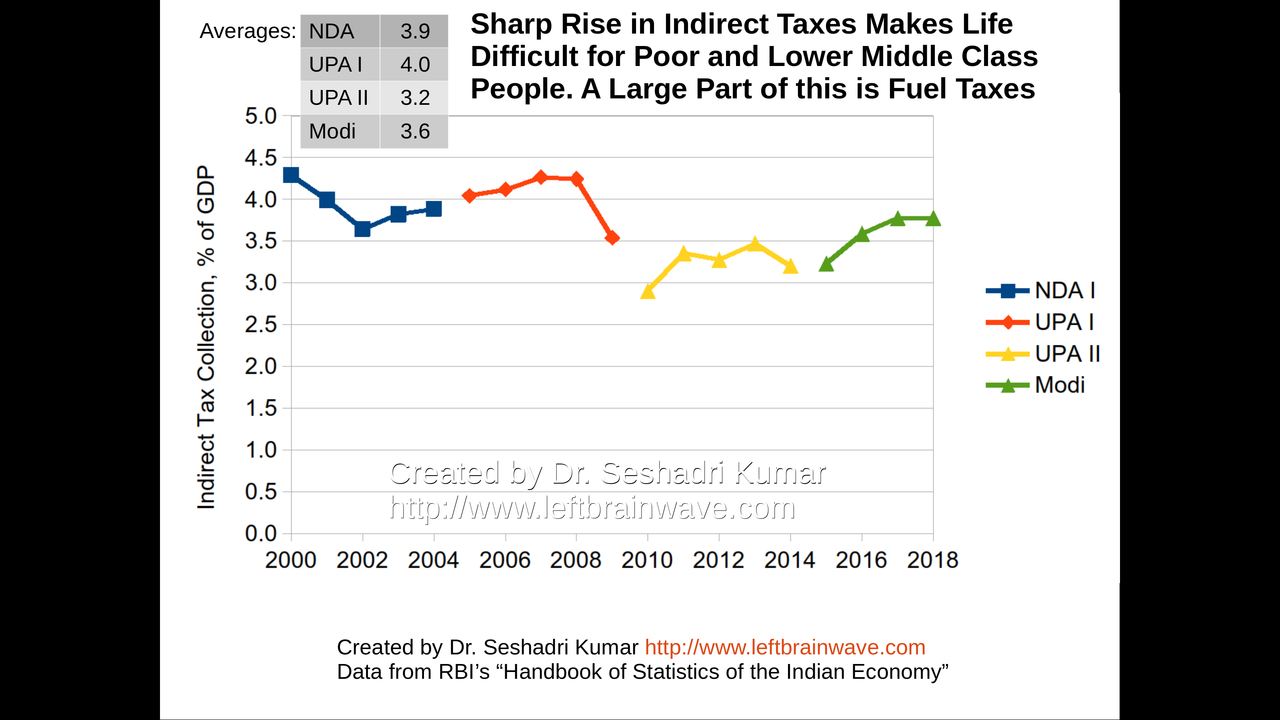
Indirect Tax Collection
86 / 120
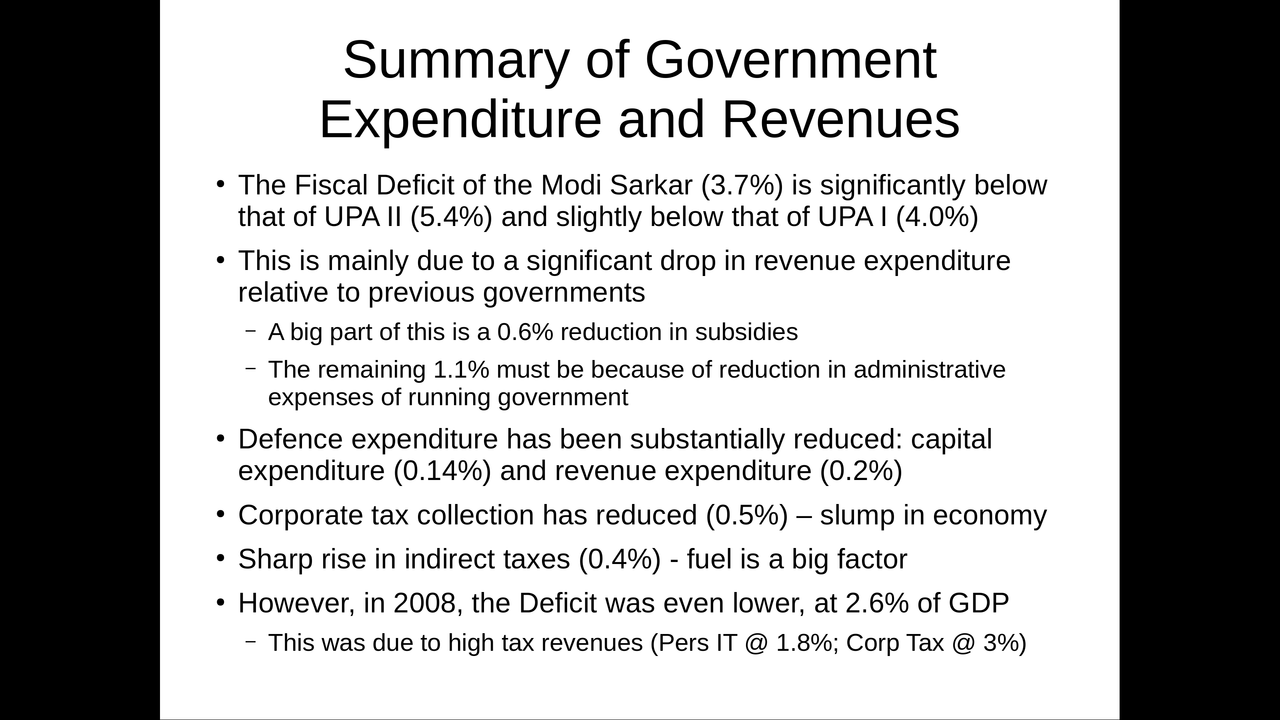
Summary: Government Expenditures and Revenues
87 / 120
Foreign Trade
88 / 120
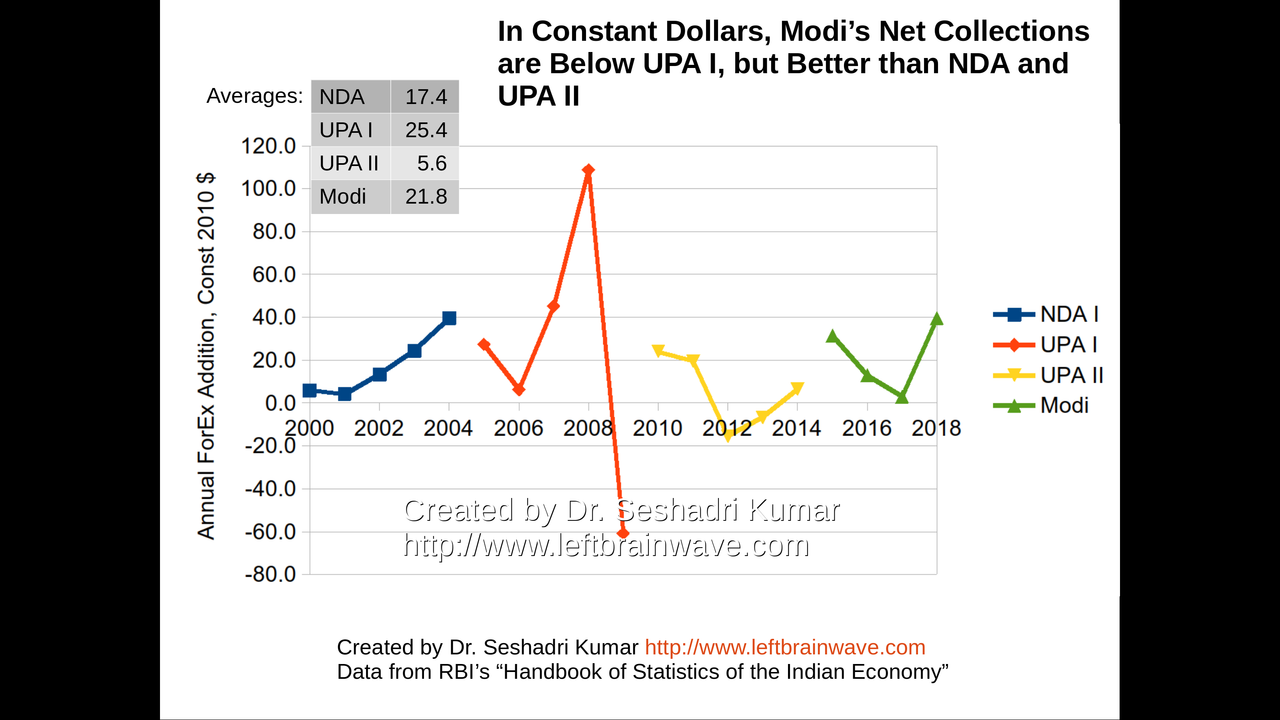
Annual Foreign Exchange Addition
89 / 120
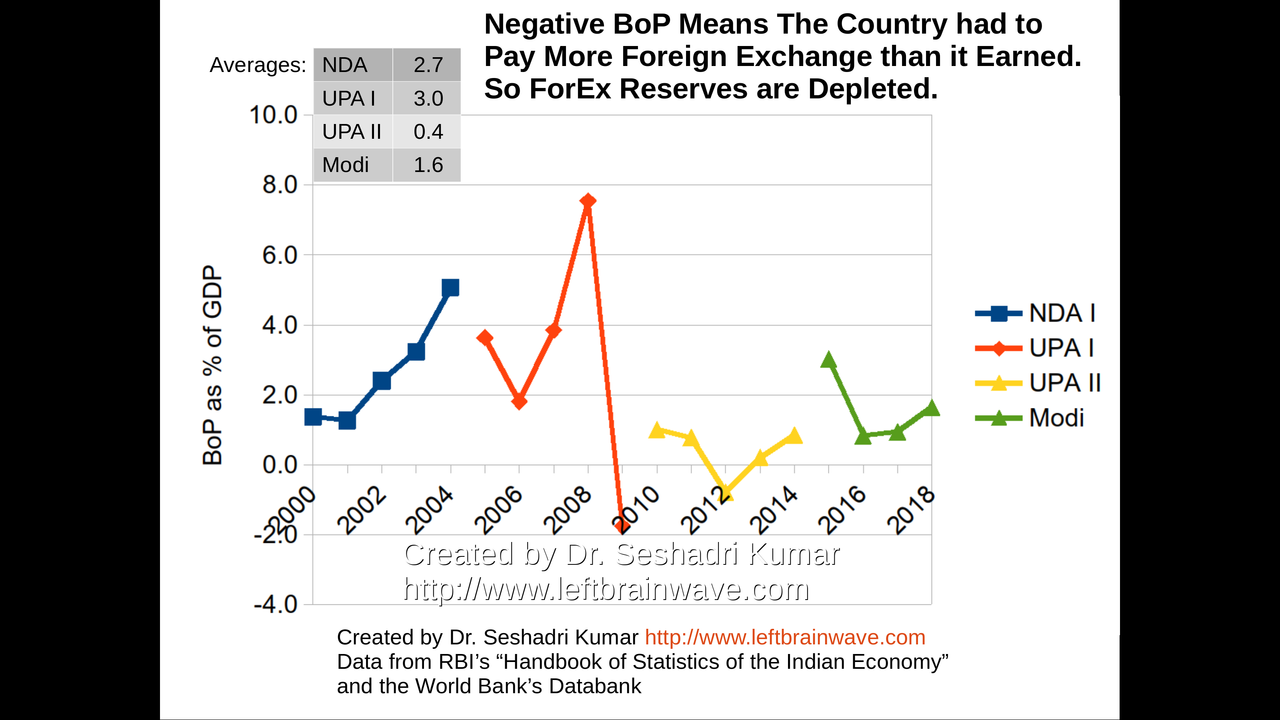
Balance of Payments
90 / 120

Constituents of Balance of Payments
91 / 120
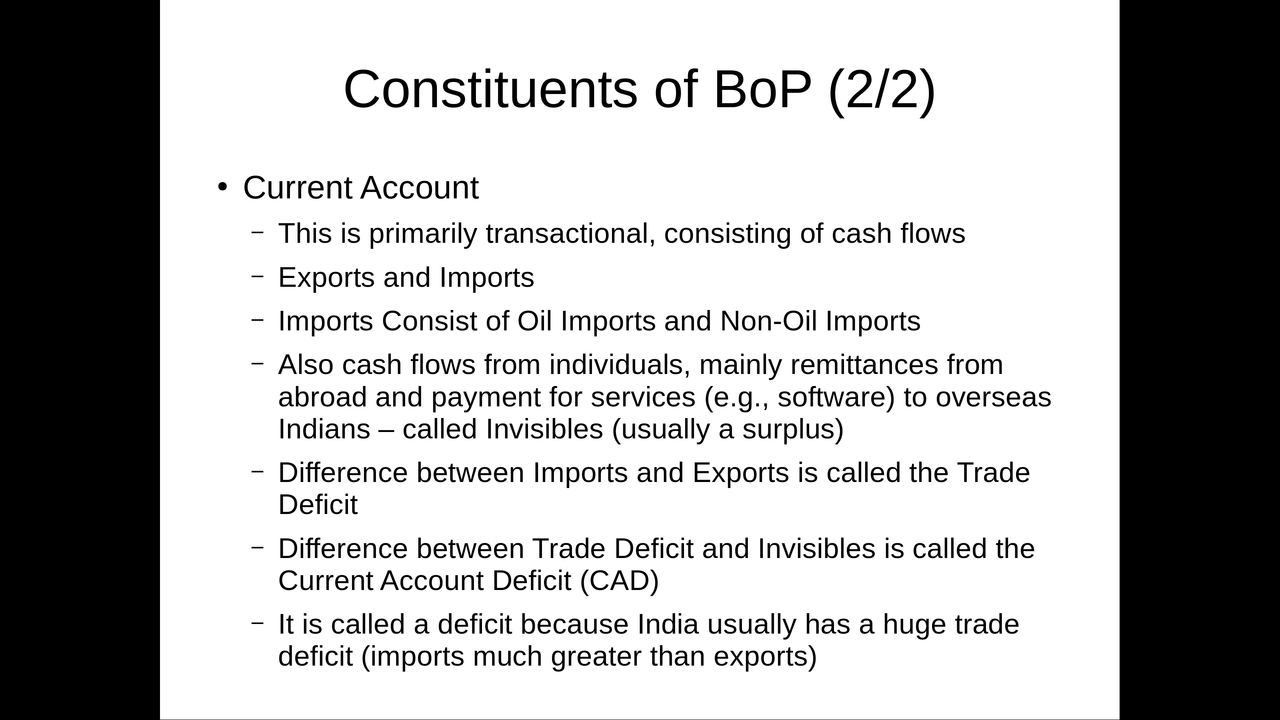
Constituents of Balance of Payments
92 / 120
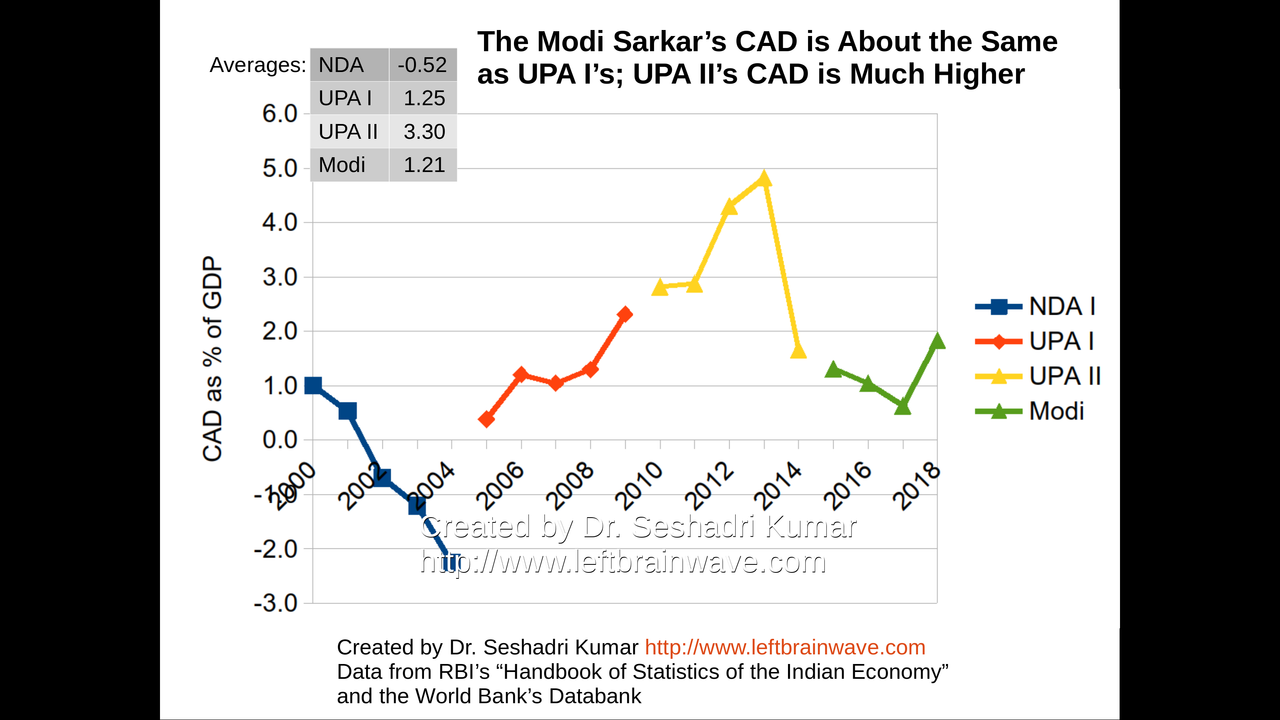
Current Account Deficit
93 / 120
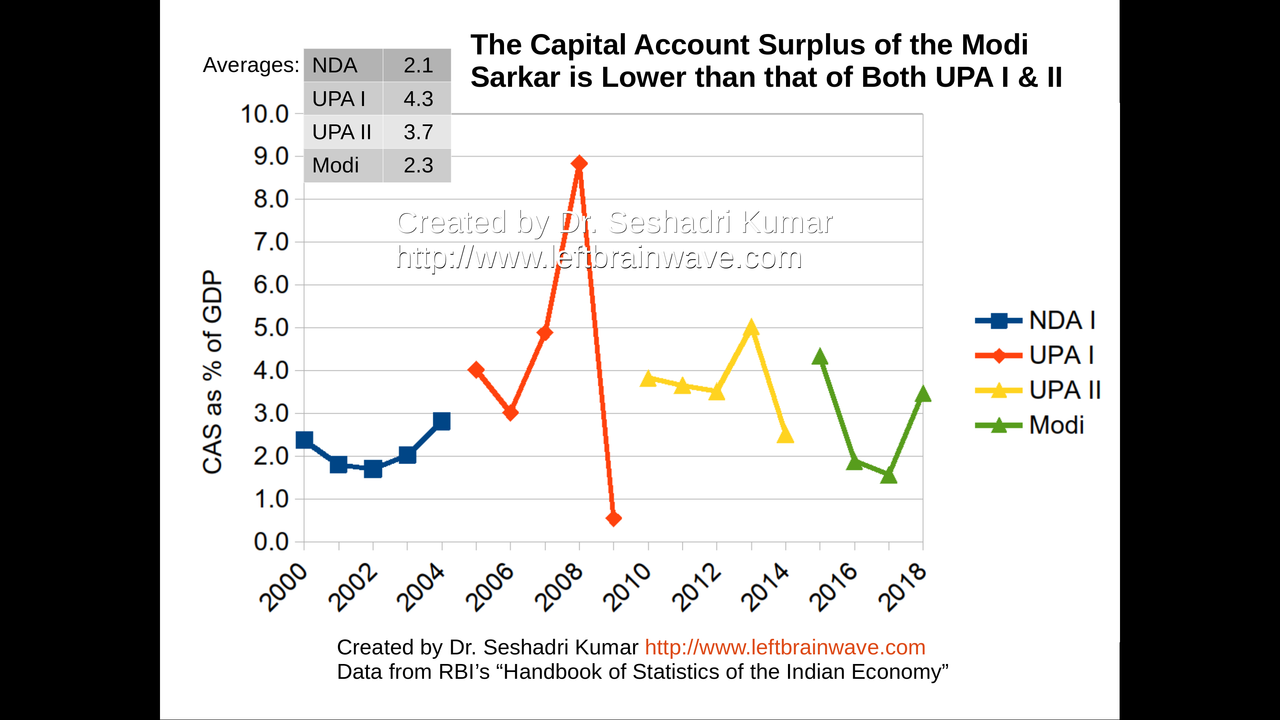
Capital Account Surplus
94 / 120
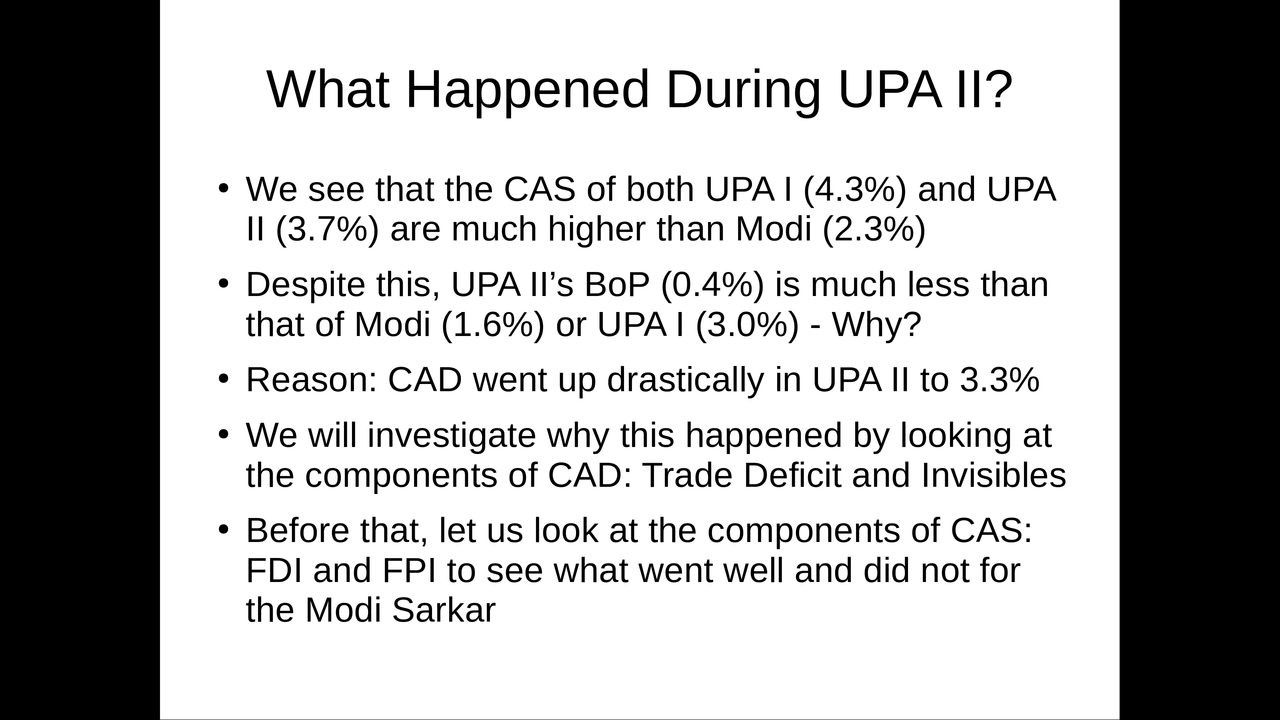
What Happened During UPA II?
95 / 120
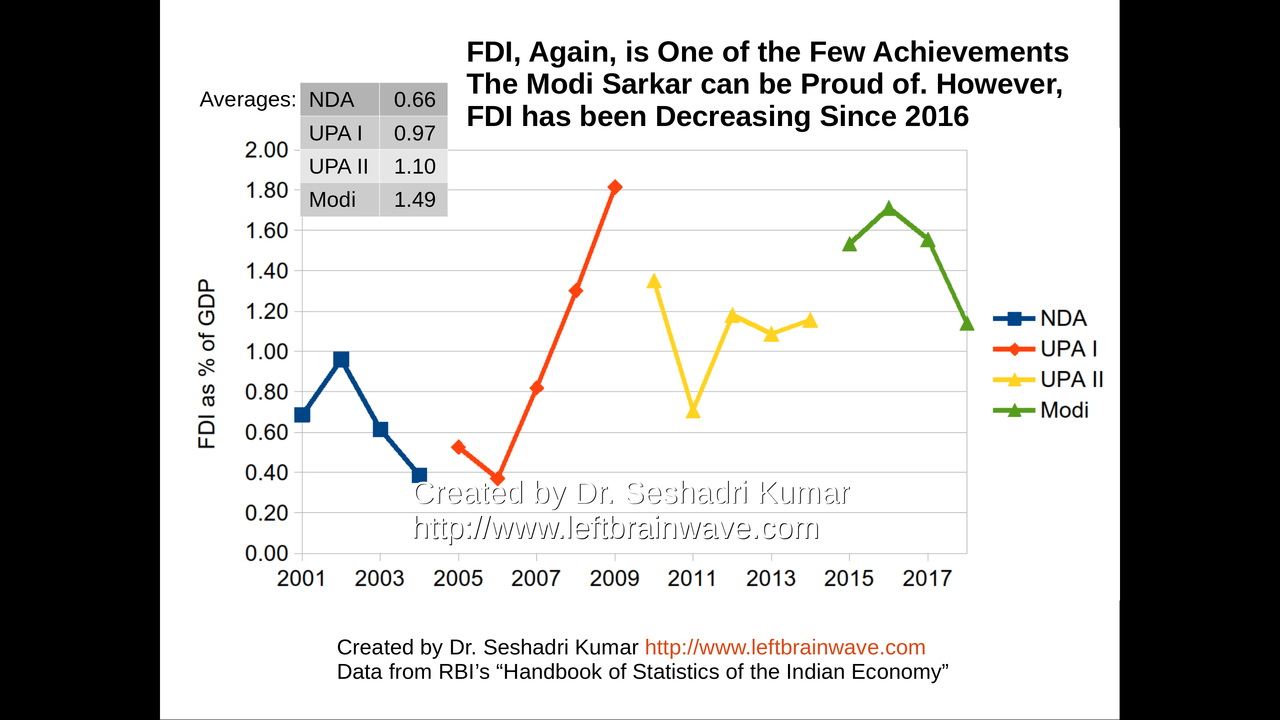
Foreign Direct Investment
96 / 120
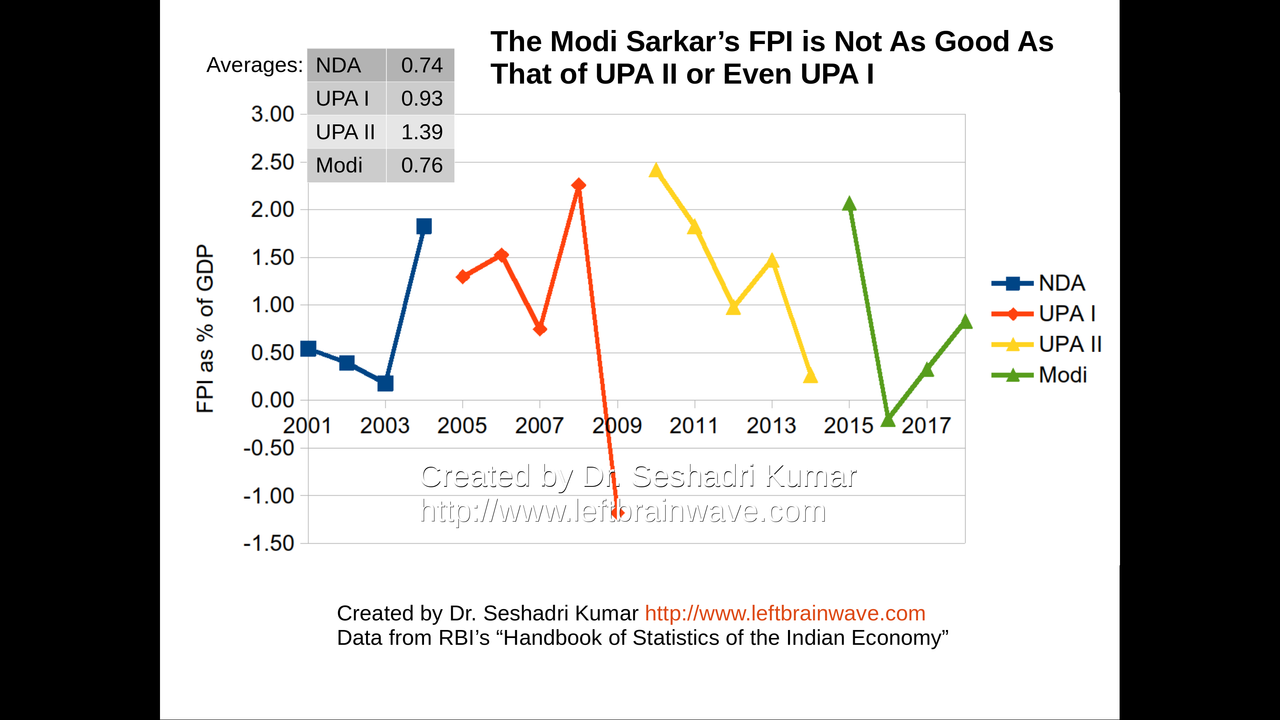
Foreign Portfolio Investment
97 / 120
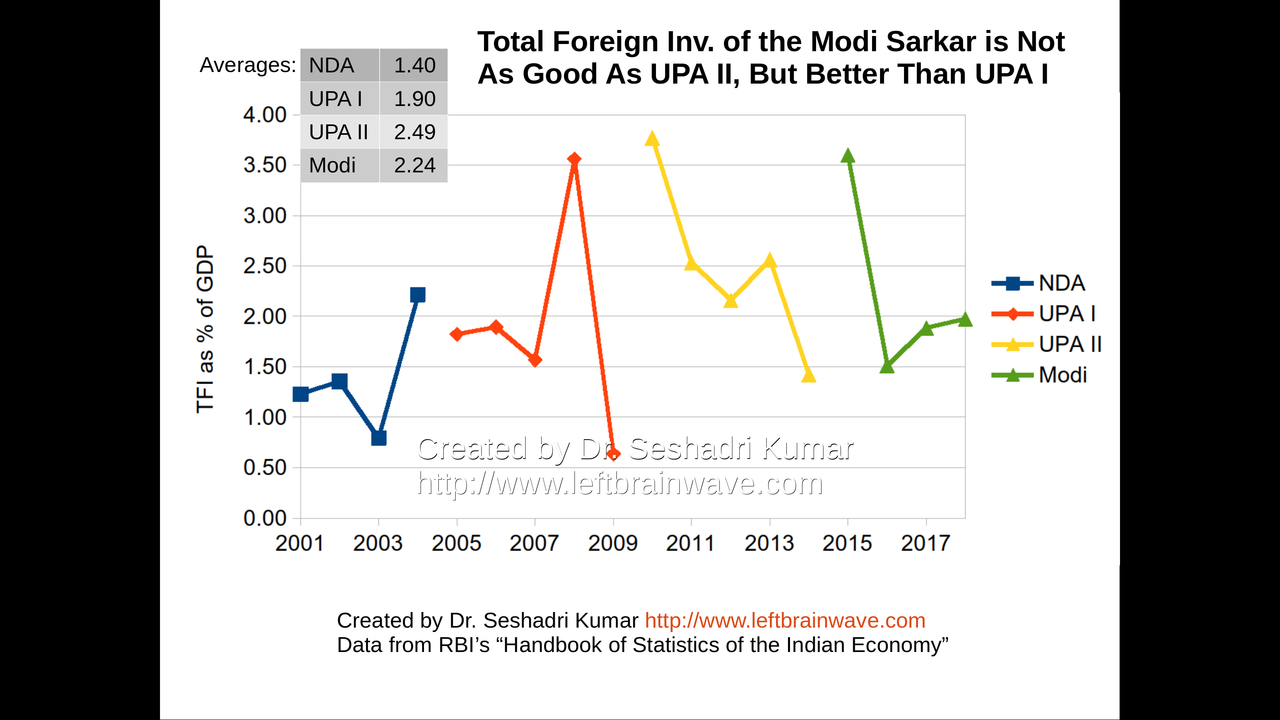
Total Foreign Investment
98 / 120
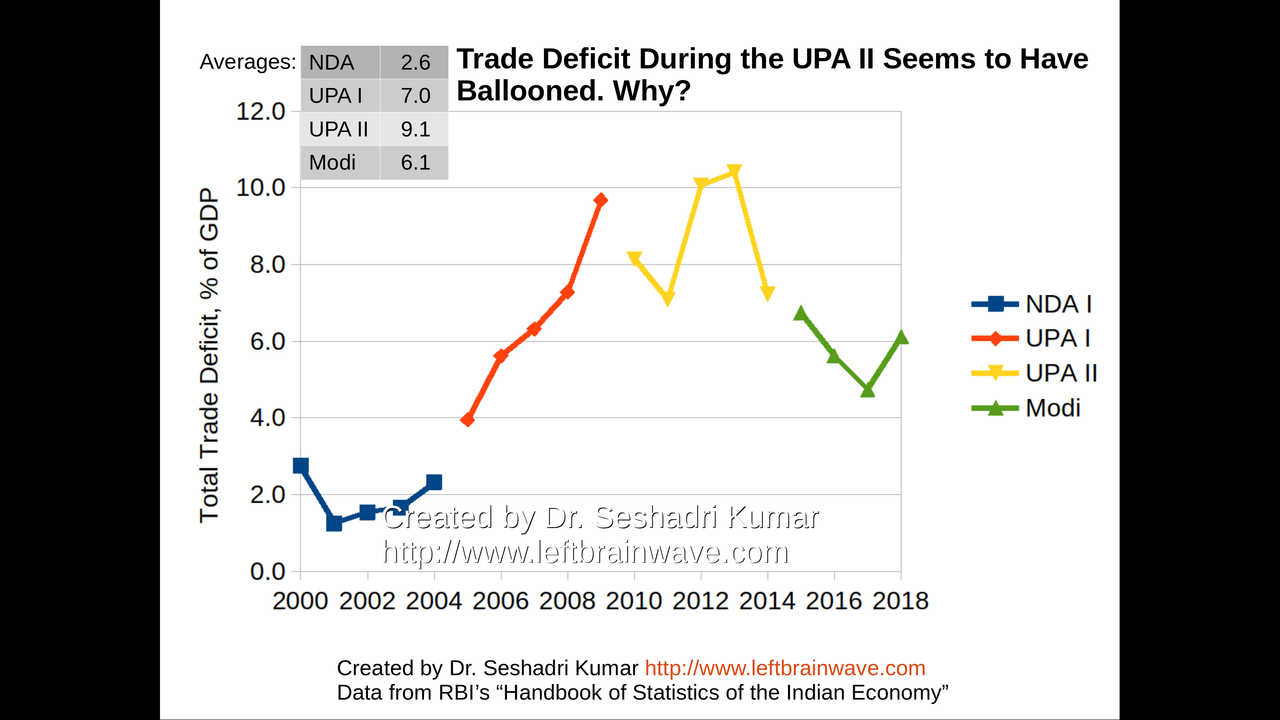
Trade Deficit
99 / 120

Invisibles
100 / 120
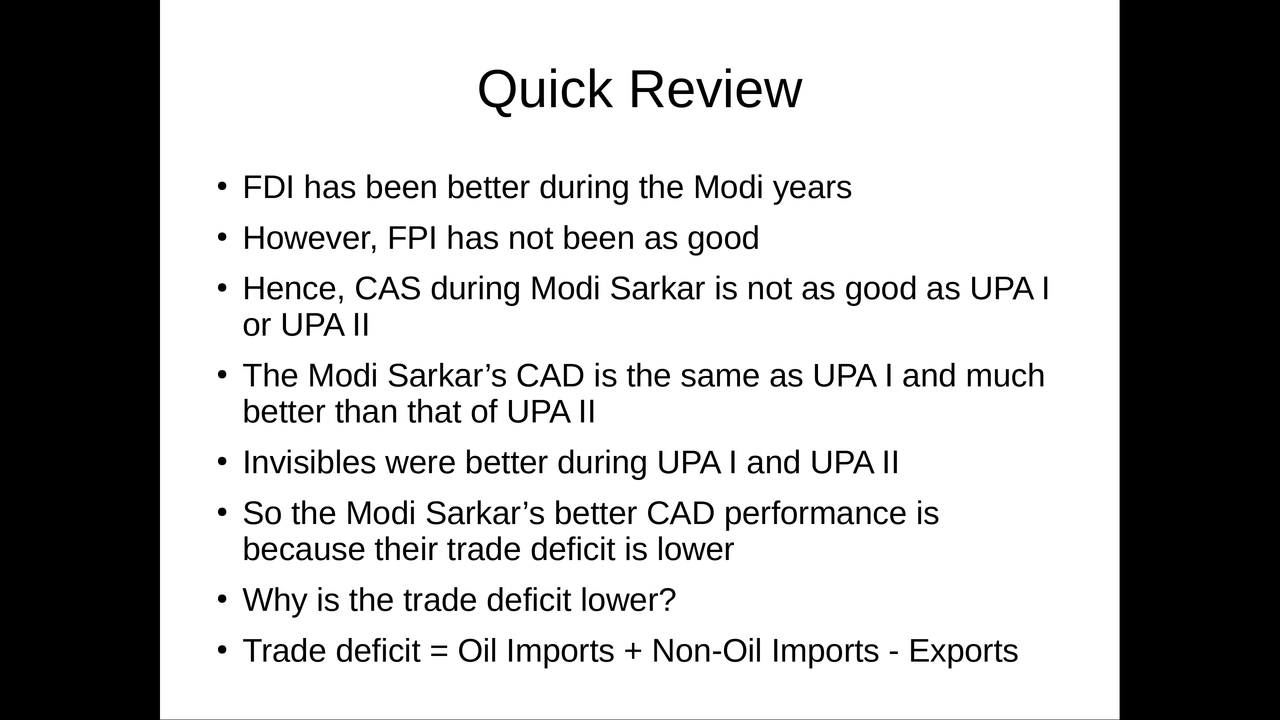
Why is the Trade Deficit Lower for the Modi Sarkar?
101 / 120
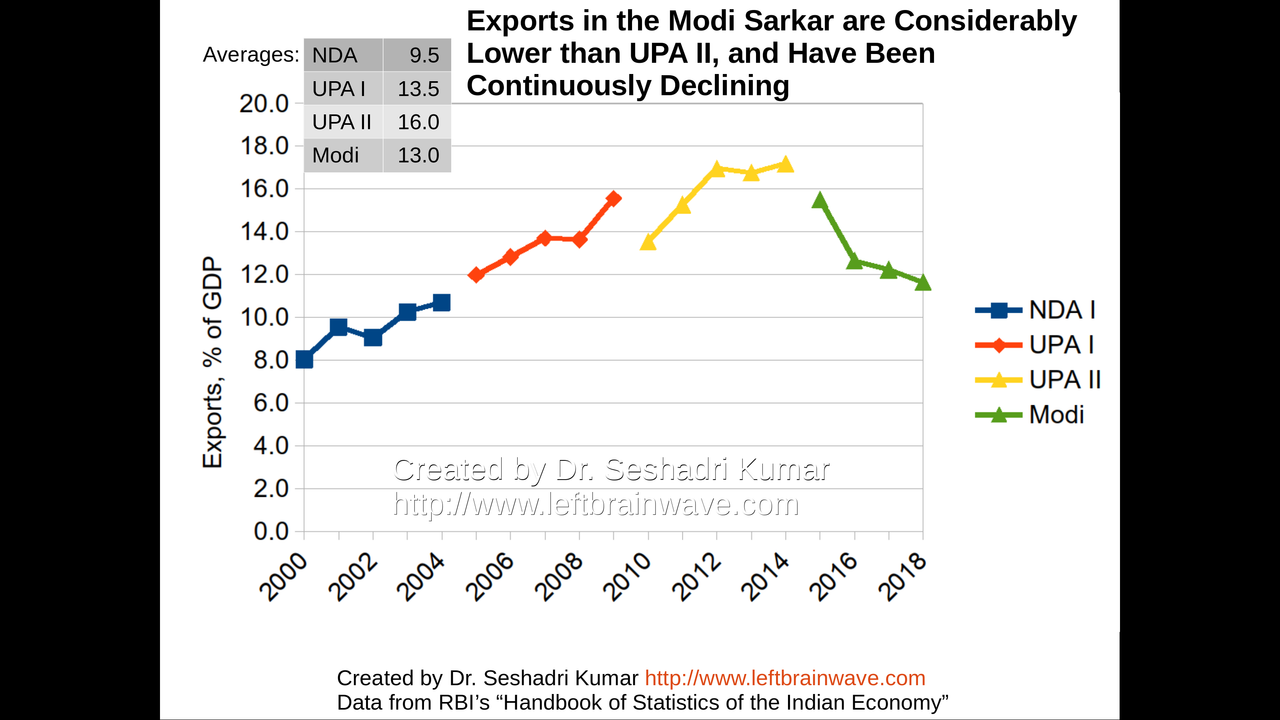
Exports
102 / 120
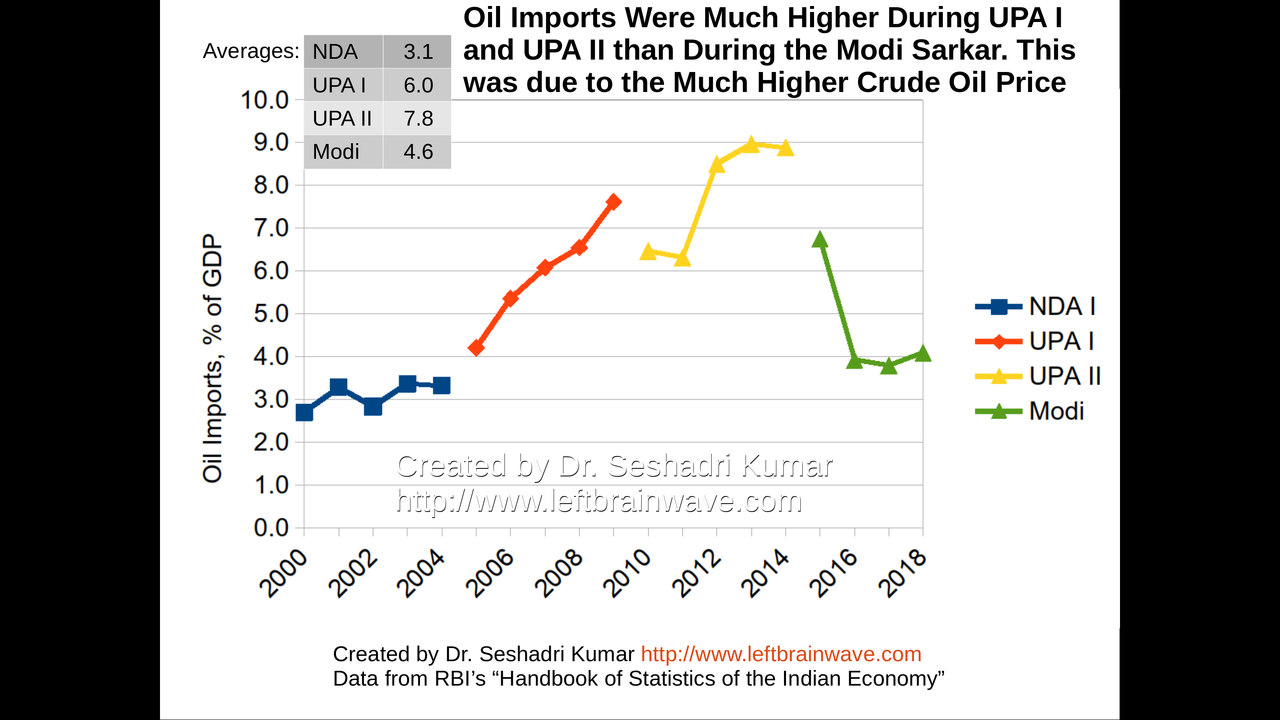
Oil Imports
103 / 120
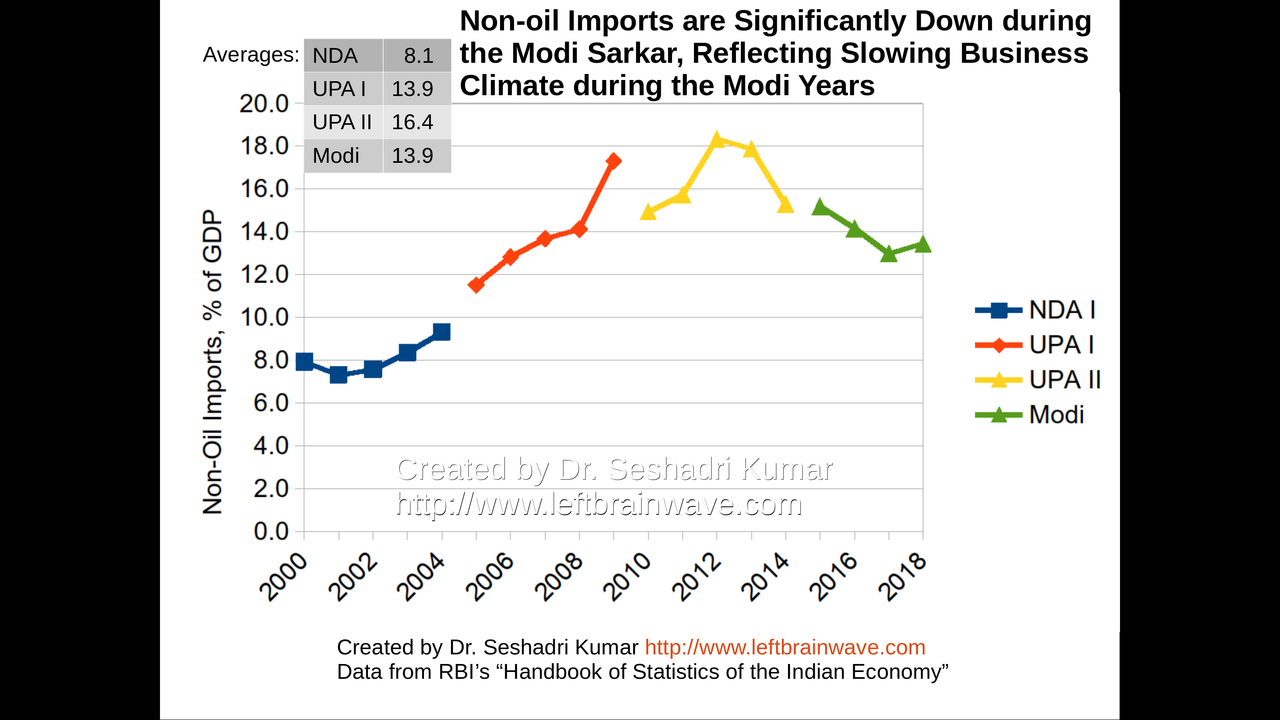
Non-Oil Imports
104 / 120
Summary of Foreign Trade
105 / 120
Effect of Oil Prices on UPA I and UPA II
106 / 120

CAD with Oil Import Costs as in Modi Sarkar
107 / 120
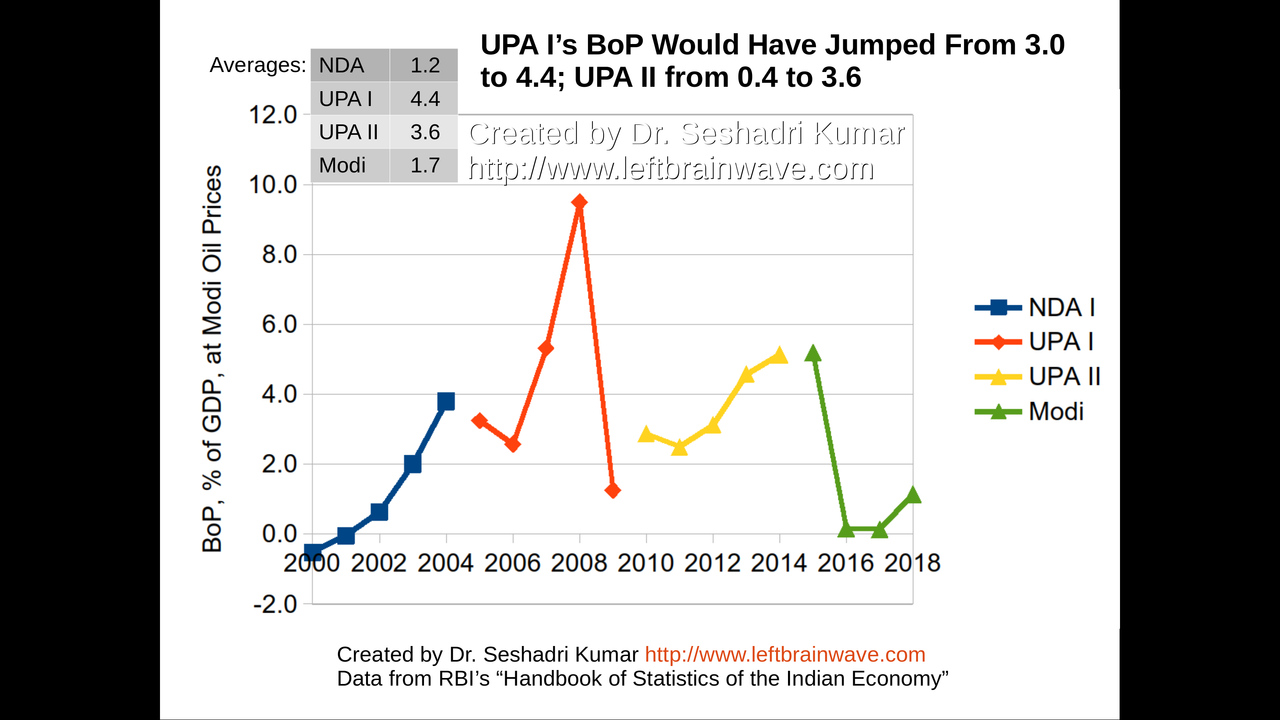
BoP with Oil Import Costs as in Modi Sarkar
108 / 120
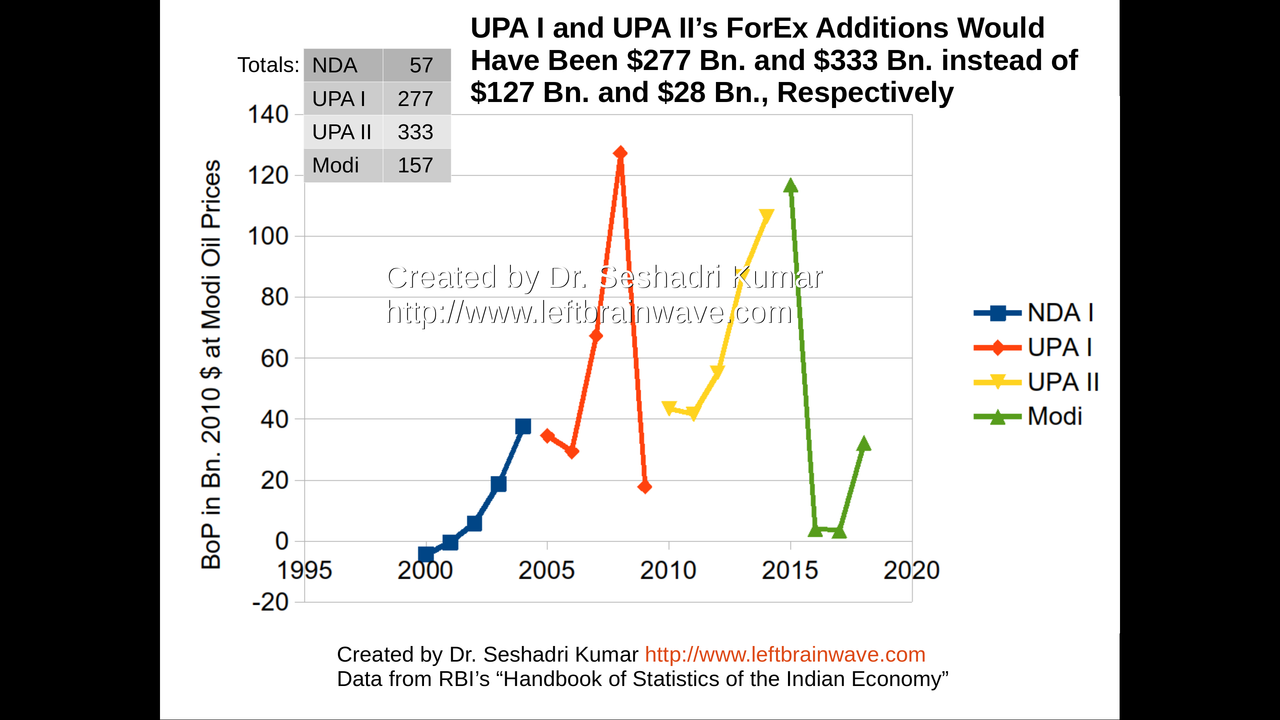
Foreign Exchange Additions at Modi Sarkar Oil Prices
109 / 120
Inflation and Unemployment (1/3)
110 / 120
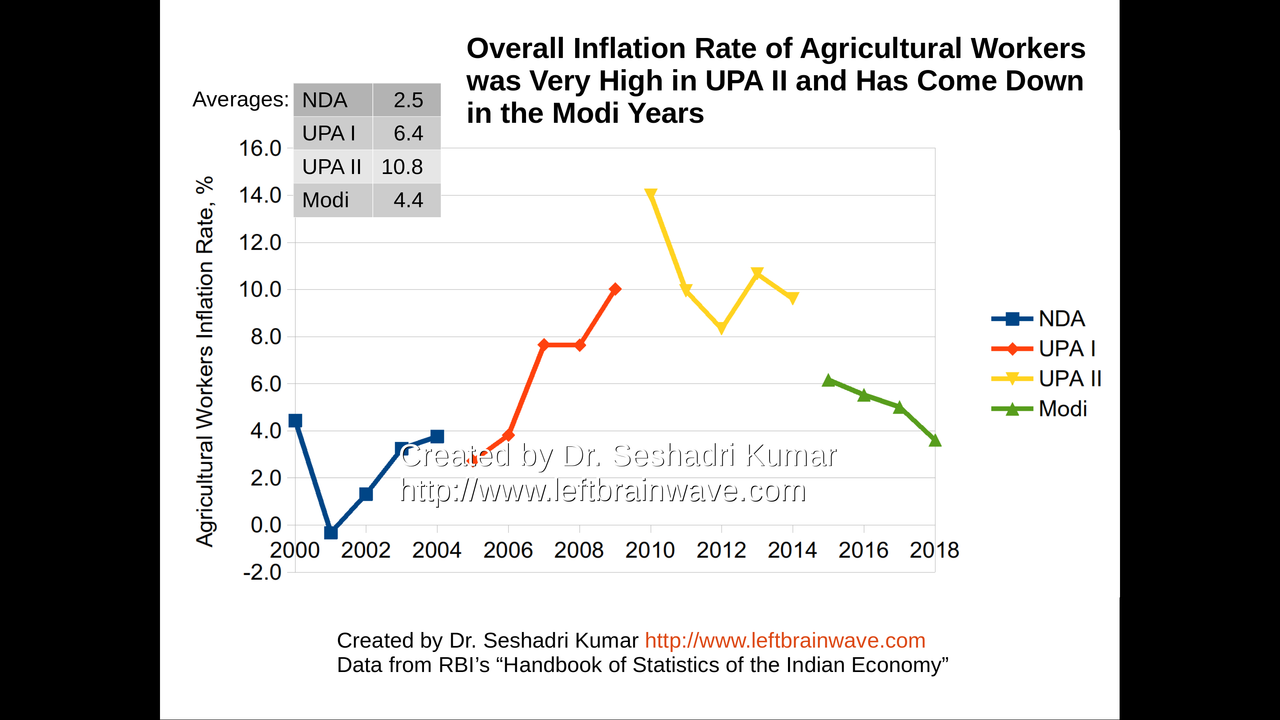
Inflation Rate for Agricultural Workers
111 / 120
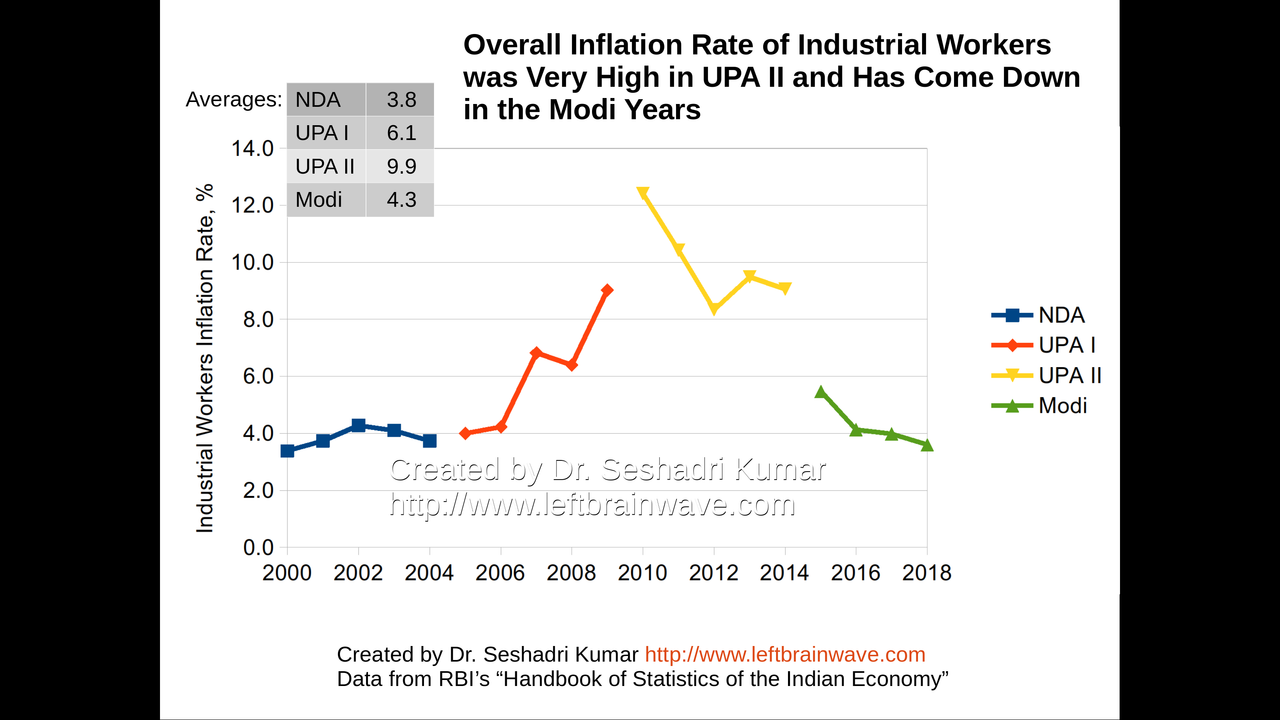
Inflation Rate for Industrial Workers
112 / 120
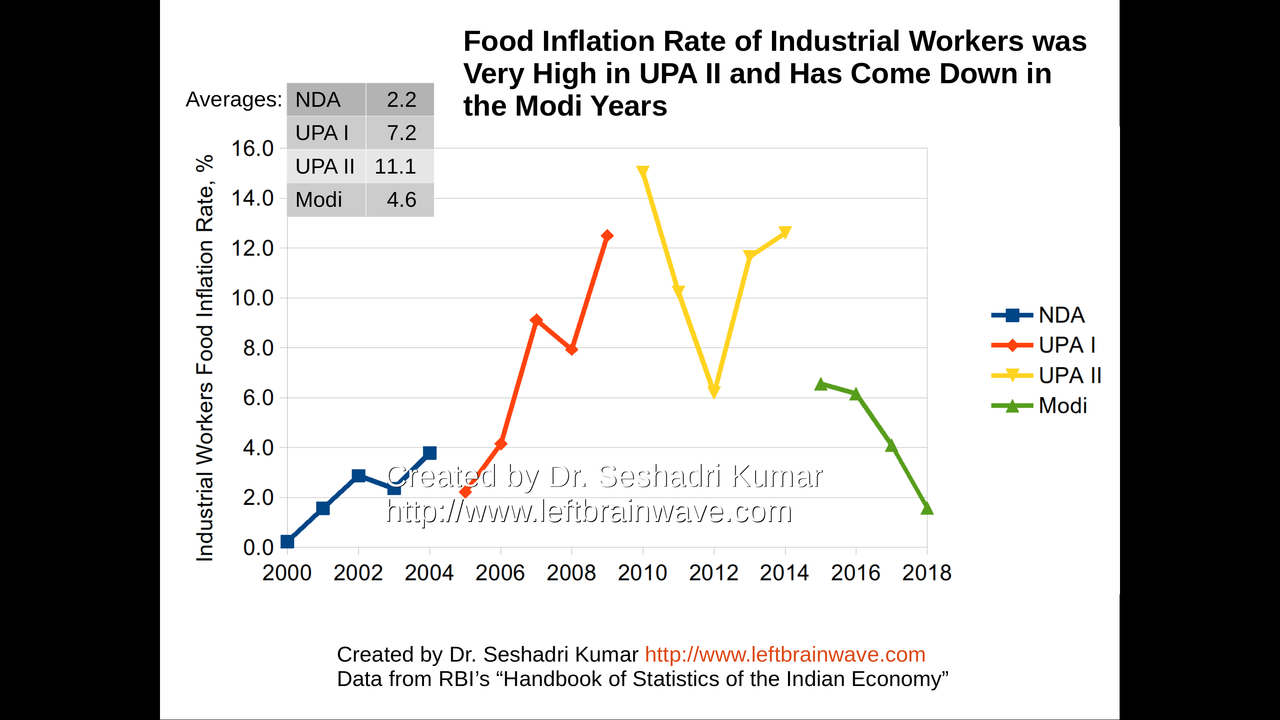
Food Inflation Rate for Industrial Workers
113 / 120
Inflation and Unemployment (2/3)
114 / 120
Inflation and Unemployment (3/3)
115 / 120
Overall Summary and Conclusions (1/3)
116 / 120
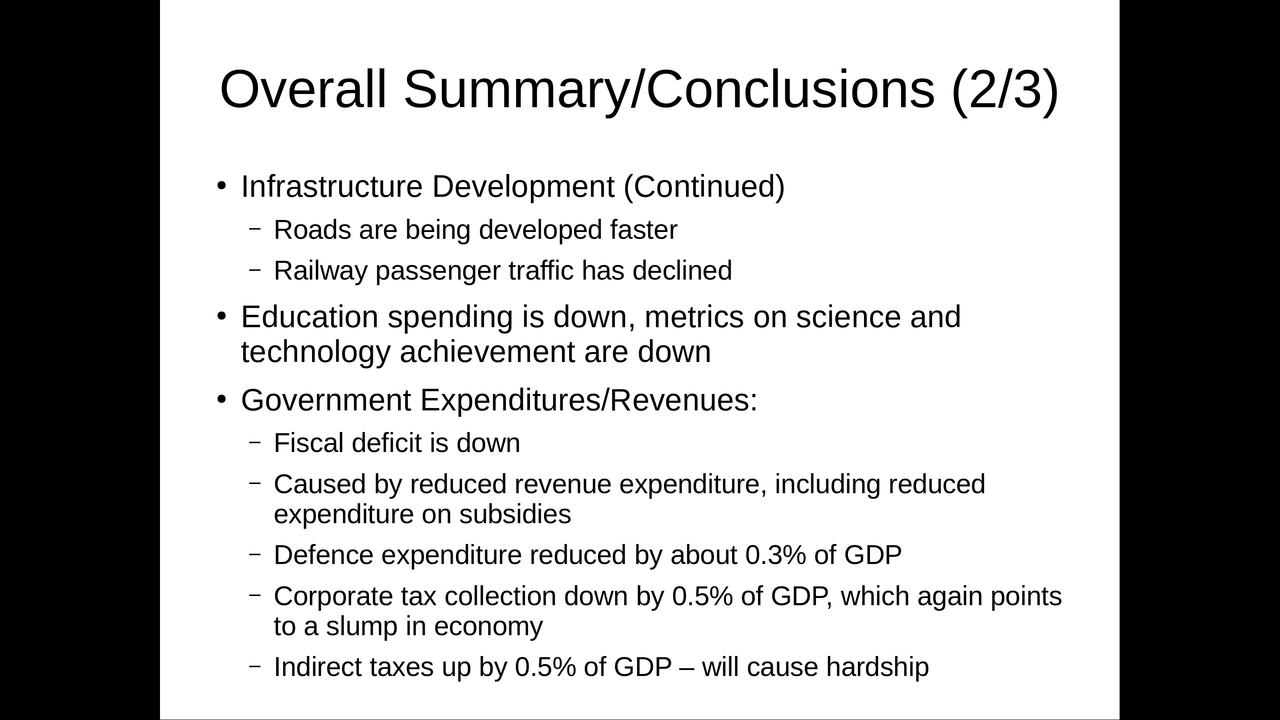
Overall Summary and Conclusions (2/3)
117 / 120
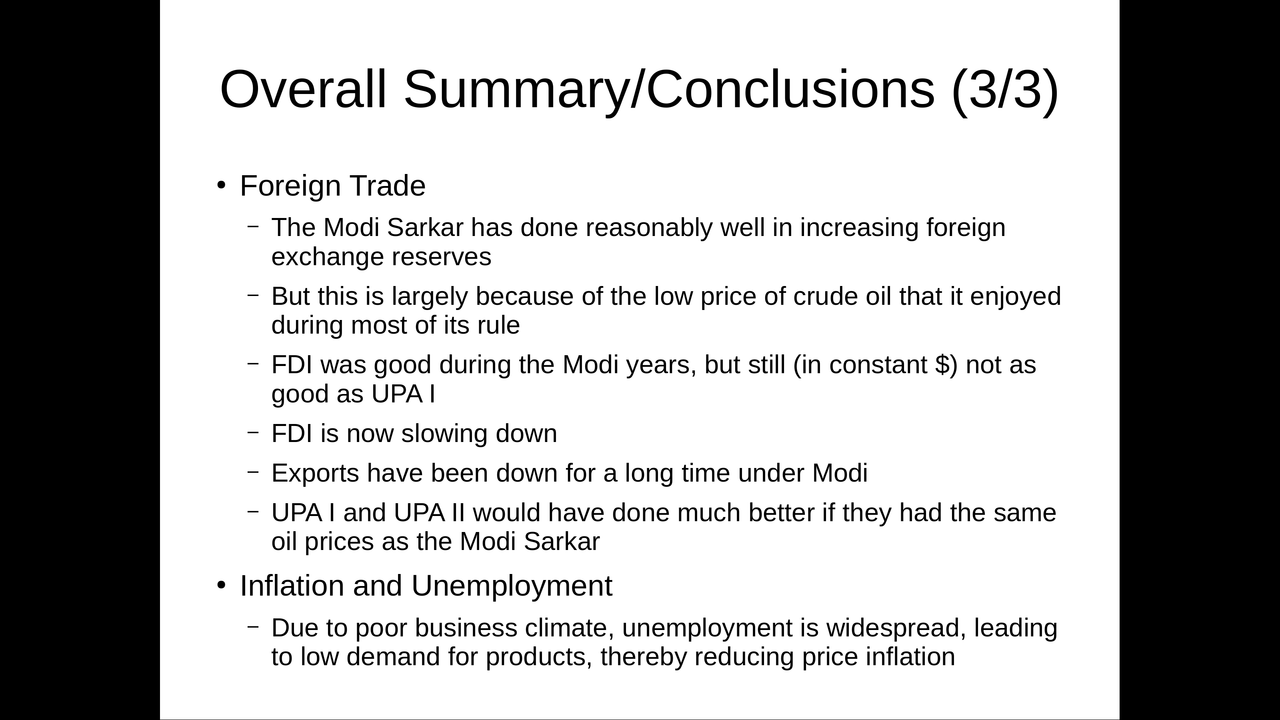
Overall Summary and Conclusions (3/3)
118 / 120
External Factors
119 / 120
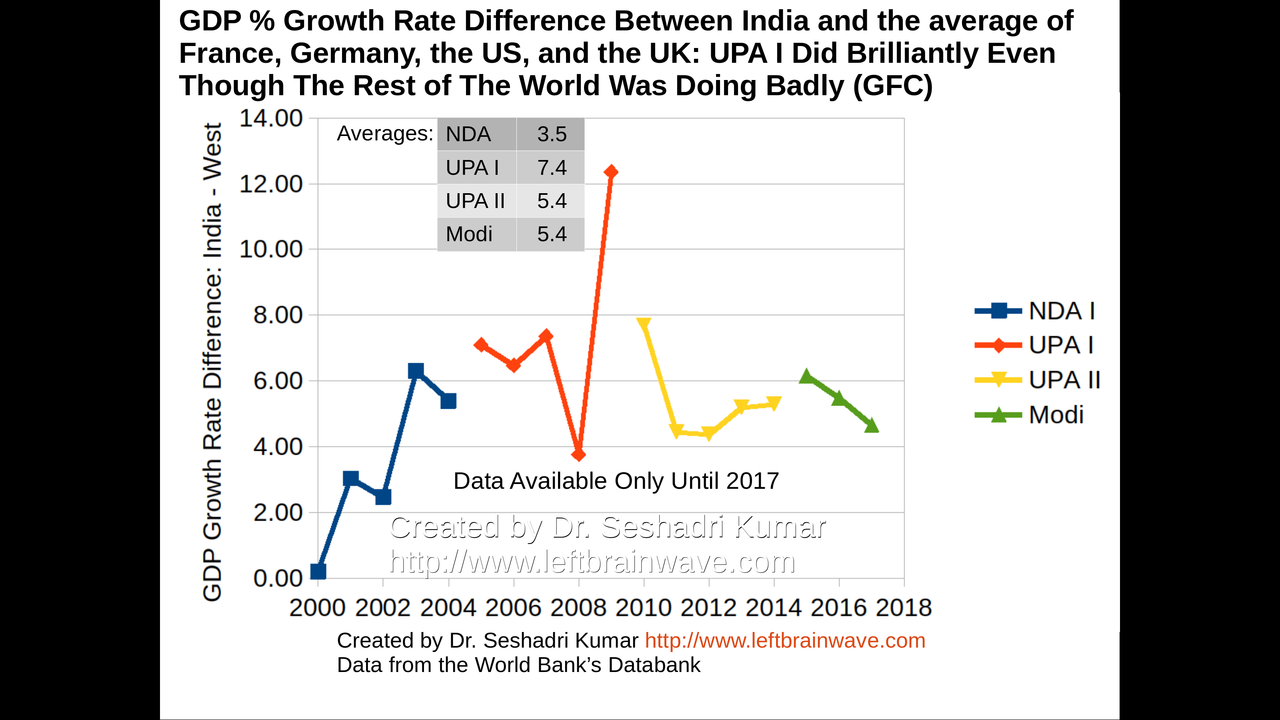
Performance of UPA-I Government during Global Financial Crisis of 2008
120 / 120
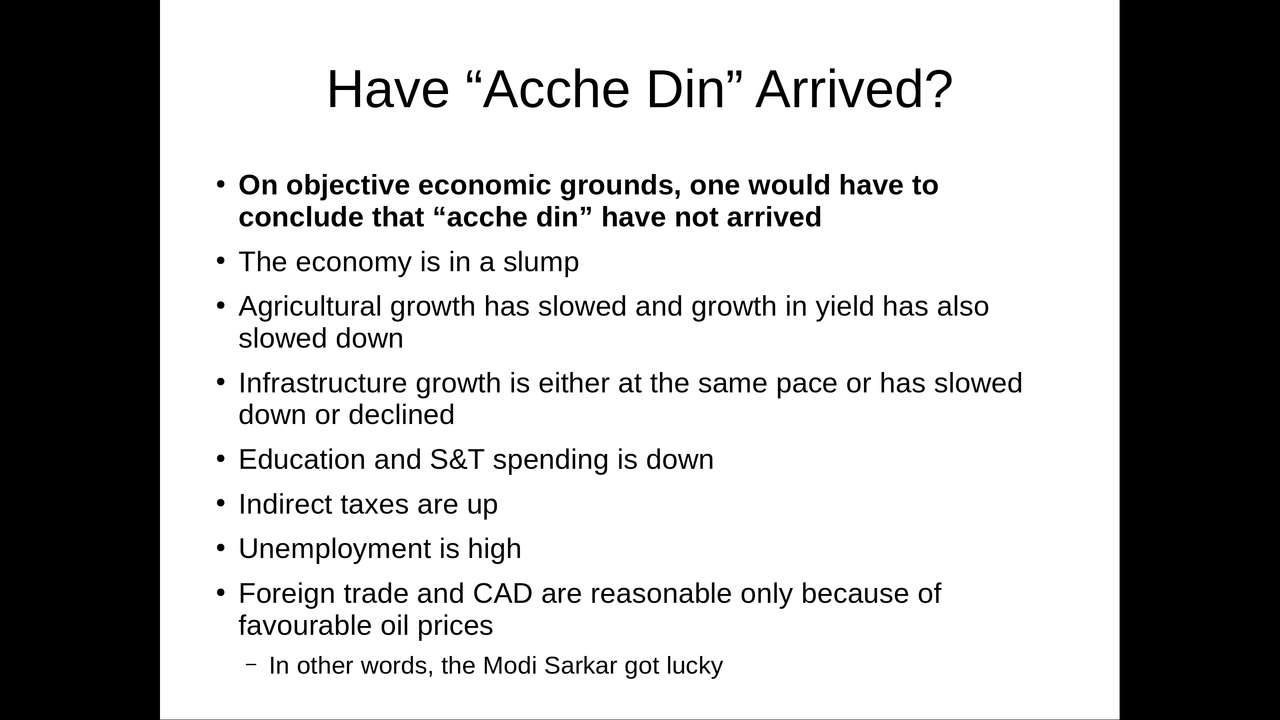
Have Acche Din Arrived?
An effort in right quest, however data containing to the period under Modi is not reflecting for latest couple of years, giving an impression that either it has been ignored or not available; Thus in both scenarios, the conclusions are false and unreasonable .
ReplyDeleteWhatever data has been provided by the government has been used. Nothing has been ignored. In most cases there is data upto 2018, which is the last annual data possible. That's four years of data on Modi. Good enough for an evaluation.
DeleteIn some cases, the government has not released data for the last two years. This is clearly mentioned on the graphs. You need to ask the government why it is not releasing the data for the last two years? Is it ashamed of its record? Like it does not want to acknowledge that unemployment is very high and does not want to release its own NSSO report that says unemployment is at its highest in 45 years?
The conclusions are very reasonable and true. Don't shoot the messenger because you don't like the truth.
can we get a PDF of the report. I don't have access to this!
ReplyDeleteThanks for suggesting good list. I appreciate your work this is really helpful for everyone. Get more information at bridging loan for student accommodation. Keep posting such useful information.
ReplyDeleteSelling your own home can be an enjoyment or perhaps depleting action since you need to set up your home and fix the imperfections or deformity of your home. You can pick without anyone else whether you need to sell your own home without anyone else or you might need to utilize a realtor to sell your home. Wohnungsauflösung Berlin
ReplyDelete